Flux Charts - S&D Automation💎 GENERAL OVERVIEW
The MTF Supply & Demand Zones (S&D) Automation is a powerful and versatile tool designed to help traders rigorously test their trading strategies against historical market data. With various advanced settings, traders can fine-tune their strategies, assess performance, and identify key improvements before deploying in live trading environments. This tool offers a wide range of configurable settings, explained within this write-up.
Features of the new S&D Automation:
Step By Step : Configure your strategy step by step, which will allow you to have OR & AND logic in your strategies.
Highly Configurable : Offers multiple parameters for fine-tuning trade entry and exit conditions.
Multi-Timeframe Analysis : Allows traders to analyze multiple timeframes simultaneously for enhanced accuracy.
Provides advanced stop-loss, take-profit, and break-even settings.
Incorporates Supply & Demand Zone conditions, with settings like Sensitivity, Zone Invalidation, Minimum Zone Width & Minimum Zone Length settings for refined strategy execution.
🚩 UNIQUENESS
The S&D Automation stands out from conventional backtesting tools due to its unparalleled flexibility, precision, and advanced trading logic integration. Key factors that make it unique include:
✅ Comprehensive Strategy Customization – Unlike traditional backtesters that offer basic entry and exit conditions, S&D Automation provides a highly detailed parameter set, allowing traders to fine-tune their strategies with precision.
✅ Multi-Timeframe Supply & Demand Zones – This is the first-ever tool that allows traders to backtest Supply & Demand zones on multiple timeframes.
✅ Customizable Take-Profit Conditions – Offers various methods to set take-profit exits, including using core features from Supply & Demand Zones, and fixed exits like ATR, % change or price change, enabling traders to tailor their exit strategies to specific market behaviors.
✅ Customizable Stop-Loss Conditions – Provides several ways to set up stop losses, including using concepts from Supply & Demand Zones and trailing stops or fixed exits like ATR, % change or price change, allowing for dynamic risk management tailored to individual strategies.
✅ Integration of External Indicators – Allows the inclusion of other indicators or data sources from TradingView for creating strategy conditions, enabling traders to enhance their strategies with additional insights and data points.
By integrating these advanced features, S&D Automation ensures that traders can rigorously test and optimize their strategies with great accuracy and efficiency.
📌 HOW DOES IT WORK ?
The first setting you will want to set it the pyramiding setting. This setting controls the number of simultaneous trades in the same direction allowed in the strategy. For example, if you set it to 1, only one trade can be active in any time, and the second trade will not be entered unless the first one is exited. If it is set to 2, the script will handle both of them at the same time. Note that you should enter the same value to this pyramiding setting, and the pyramiding setting in the "Properties" tab of the script for this to work.
You can enable and set a backtesting window that will limit the entries to between the start date & end date.
Then, you can enter your desired settings for Supply & Demand Zones. You can also enable and set up to 3 timeframes, which you can use later on when customizing your strategies enter / exit conditions.
Entry Conditions
From the "Long Conditions" or the "Short Conditions" groups, you can set your position entry conditions. For settings like "initial capital" or "order size", you can open the "Properties" tab, where these are handled.
The S&D Automation can use the following conditions for entry conditions :
1. Demand Zone
Detection: Triggered when a Demand Zone forms or is detected
Retest: Triggered when price retests a Demand Zone. A retest is confirmed when a candle enters a Demand Zone and closes outside of it.
2nd Retest: Triggered when price retests a Demand Zone for the second time. A retest is confirmed when a candle enters a Demand Zone and closes outside of it.
3rd Retest: Triggered when price retests a Demand Zone for the third time. A retest is confirmed when a candle enters a Demand Zone and closes outside of it.
Retracement: Triggered when price touches a Demand Zone
Break: Triggered when a Demand Zone is invalidated by candle close or wick, depending on the user's input.
2. Supply Zone
Detection: Triggered when a Supply Zone forms or is detected
Retest: Triggered when price retests a Supply Zone. A retest is confirmed when a candle enters a Supply Zone and closes outside of it.
2nd Retest: Triggered when price retests a Supply Zone for the second time. A retest is confirmed when a candle enters a Supply Zone and closes outside of it.
3rd Retest: Triggered when price retests a Supply Zone for the third time. A retest is confirmed when a candle enters a Supply Zone and closes outside of it.
Retracement: Triggered when price touches a Supply Zone
Break: Triggered when a Supply Zone is invalidated by candle close or wick, depending on the user's input.
3. Any Zone
Detection: Triggered when any Supply or Demand Zone forms or is detected
Retest: Triggered when price retests any Supply or Demand Zone. A retest is confirmed when a candle enters any Supply or Demand Zone and closes outside of it.
2nd Retest: Triggered when price retests any Supply or Demand Zone for the second time. A retest is confirmed when a candle enters any Supply or Demand Zone and closes outside of it.
3rd Retest: Triggered when price retests any Supply or Demand Zone for the third time. A retest is confirmed when a candle enters any Supply or Demand Zone and closes outside of it.
Retracement: Triggered when price touches any Supply or Demand Zone
Break: Triggered when any Supply or Demand Zone is invalidated by candle close or wick, depending on the user's input.
🕒 TIMEFRAME CONDITIONS
The S&D Automation supports Multi-Timeframe (MTF) features, just like the Supply & Demand indicator. When setting an entry condition, you can also choose the timeframe.
To set up MTF conditions, navigate to the 'Timeframes' section in the settings, select your desired timeframes, and enable them. You can choose up to three timeframes.
Once you've selected your timeframes, you can use them in your strategy. When setting long and short entry/exit conditions, you can choose from Timeframe 1, Timeframe 2, or Timeframe 3.
External Conditions
Users can use external indicators on the chart to set entry conditions.
The second dropdown in the external condition settings allows you to choose a conditional operator to compare external outputs. Available options include:
Less Than or Equal To: <=
Less Than: <
Equal To: =
Greater Than: >
Greater Than or Equal To: >=
The position entry conditions work like this ;
Each side has 5 S&D Zone conditions and 1 Source condition. Each condition can be enabled or disabled using the checkbox on the left side of them.
The next selection is the alert type, which you can select between "Detection", "Retest", "Retracement" or "Break".
You can select which timeframe this condition should work on from Timeframe 1, 2, or 3. If you select "Any Timeframe", the condition will work for all timeframes.
Lastly select the step of this condition from 1 to 6.
The Source Condition
The last condition on each side is a source condition that is different from the others. Using this condition, you can create your own logic using other indicators' outputs on your chart. For example, suppose that you have an EMA indicator in your chart. You can have the source condition to something like "EMA > high".
The Step System
Each condition has a step number, and conditions are in topological order based on them.
The conditions are executed step by step. This means the condition with step 2 cannot be executed before the condition with step 1 is executed.
Conditions with the same step numbers have "OR" logic. This means that if you have 2 conditions with step 3, the condition with step 4 can trigger after only one of the step 3 conditions is executed.
➕ OTHER ENTRY FEATURES
The S&D Automation allows traders to choose when to execute trades and when not to execute trades.
1. Only Take Trades
This setting lets users specify the time period when their strategy can open or execute trades.
2. Don't Take Trades
This setting lets users specify time periods when their strategy can't open or execute trades.
↩️ EXIT CONDITIONS
1. Exit on Opposite Signal
When enabled, a long position will close when short entry conditions are met, and a short position will close when long entry conditions are met.
2. Exit on Session End
When enabled, positions will be closed at the end of the trading session.
📈 TAKE PROFIT CONDITIONS
There are several methods available for setting take profit exits and conditions.
1. Entry Condition TP
Users can use entry conditions as triggers for take-profit exits. This setting can be found under the long and short exit conditions.
2. Fixed TP
Users can set a fixed TP for exits. This setting can be found under the long and short exit conditions. Users can choose between the following:
Price: This method triggers a TP exit when price reaches a specified level. For example, if you set the Price TP to 10 and buy NASDAQ:TSLA at $190, the trade will automatically exit when the price reaches $200 ($190 + $10).
Ticks: This method triggers a TP exit when price moves a specified number of ticks.
Percentage (%): This method triggers a TP exit when price moves a specified percentage.
ATR: This method triggers a TP exit based on a specified multiple of the Average True Range (ATR).
📉 STOP LOSS CONDITIONS
There are several methods available for setting stop-loss exits and conditions.
1. Entry Condition SL
Users can use entry conditions as triggers for stop-loss exits. This setting can be found under the long and short exit conditions.
2. Fixed SL
Users can set a fixed SL for exits. This setting can be found under the long and short exit conditions. Users can choose between the following:
Price: This method triggers a SL exit when price reaches a specified level. For example, if you set the Price SL to 10 and buy NASDAQ:TSLA at $200, the trade will automatically exit when the price reaches $190 ($200 - $10).
Ticks: This method triggers a SL exit when price moves a specified number of ticks.
Percentage (%): This method triggers a SL exit when price moves a specified percentage.
ATR: This method triggers a SL exit based on a specified multiple of the Average True Range (ATR).
3. Trailing Stop
An explanation & example for the trailing stop feature is present on the write-up within the next section.
Exit conditions have the same logic of constructing conditions like the entry ones. You can construct a Take-Profit Condition & a Stop-Loss Condition. Note that the Take-Profit condition will only work if the position is in profit, regardless of if it's triggered or not. The same applies for the Stop-Loss condition, meaning that it will only work if the position is in loss.
You can also set a Fixed TP & Fixed SL based on the price movement after the position is entered. You have options like "Price", "Ticks", "%", or "Average True Range". For example, you can set a Fixed TP like "5%", and the position will be entered once it moves 5% up in a long position.
Trailing Stop
For the Fixed SL, you also have a "Trailing" stop option, for which you can set its activation level as well. The Trailing stop activation level and its value are expressed in ticks. Check this scenario for an example :
We have a ticker with a tick value of $1. Our Trailing Stop is set to 10 ticks, and the activation level is set to 30 ticks.
We buy 1 contract when the price is $100.
When the price becomes $110, we are in $10 (10 ticks) profit and the trailing stop is now activated.
The current price our stop's on is $110 - $30 (30 ticks), which is the level of $80.
The trailing stop will only move if the price moves up the highest high the price has been after we entered the position.
Let's suppose that price moves up $40 right after our trailing stop is activated. The price will now be $150, and our trailing stop will sit on $150 - $30 (30 ticks) = $120.
If the price is down the $120 level, our stop loss will be triggered.
There is also a "Hard SL" option designed for a backup stop-loss when trailing stops are enabled. You can enable & set this option and if the price goes down before our trailing stop even activates, the position will be exited.
You can also move stop-loss to the break-even (entry price of the position) after a certain profit is achieved using the last setting of the exit conditions. Note that for this to work, you must have a Fixed SL set-up.
➕ OTHER EXIT FEATURES
1. Move Stop Loss to Breakeven
This setting allows the strategy to automatically move the SL to Breakeven (BE) when the position is in profit by a certain amount. Users can choose between the following:
Price: This method moves the SL to BE when price reaches a specified level.
Ticks: This method moves the SL to BE when price moves a specified number of ticks.
Percentage (%): This method moves the SL to BE when price moves a specified percentage.
ATR: This method moves the SL to BE when price moves a specified multiple of the Average True Range (ATR).
Example Entry Scenario
To give an example , check this scenario; out conditions are :
LONG CONDITIONS
Demand Zone Detection, Step 1
Supply Zone Retest, Step 2
Demand Zone Break, Step 2
open > close, Step 3
First, the strategy needs to detect a Demand Zone Detection in order to start working.
After it's detected, now it's looking for either a Supply Zone Retest, or a Demand Zone Break to proceed to the next step, the reason for this is that they both have the same step number.
After one of them is detected, the strategy will consistently check candlesticks for the condition open > close. If a bullish candlestick occurs, a long position will be entered.
⏰ ALERTS
This indicator uses TradingView's strategy alert system. All entries and exits will be sent as an alert if configured. It's possible to further customize these alerts to your liking. For more information check TradingView's strategy alert customization page : www.tradingview.com
⚙️ SETTINGS
1. Backtesting Settings
Pyramiding: Controls the number of simultaneous trades allowed in the strategy. This setting must have the same value that is entered on the script's properties tab on the settings pane.
Enable Custom Backtesting Period: Restricts backtesting to a specific date range.
Start & End Time Configuration: Define precise start and end dates for historical analysis.
2. General Configuration
Detection Method: There are two detection methods you can choose from for identifying Supply & Demand Zones. Both methods aim to identify key areas where price is likely to react, but they do so using different approaches. Traders can choose the method that aligns with their trading style and time horizon.
Sensitivity: The Sensitivity setting allows traders to adjust how aggressively the script identifies supply and demand zones when using the Momentum Detection Method. This setting directly impacts the threshold for detecting zones when using the momentum detection method.
Zone Invalidation: The Zone Invalidation setting determines how supply and demand zones are invalidated.
Wick -> A zone is invalidated if a candle’s wick goes below a demand zone or above a supply zone.
Close -> A zone is invalidated if a candle closes below a demand zone or above a supply zone.
Zone Visibility Range: The Zone Visibility Range setting controls how far from the current price supply and demand zones are displayed on the chart. It helps traders focus on relevant zones while avoiding clutter from distant or less impactful areas.
Minimum Zone Width: The Minimum Zone Width setting defines the smallest size a supply or demand zone must have to be displayed on the chart. It uses the Average True Range (ATR) as a reference to ensure zones are proportionate to current market volatility.
Minimum Zone Length: The Minimum Zone Length setting determines the minimum number of bars a supply or demand zone must span to be displayed on the chart. This setting helps filter out short-lived or insignificant zones, ensuring only meaningful areas of supply or demand are highlighted.
3. Multi-Timeframe Analysis
Enable Up to Three Timeframes: Select and analyze trades across multiple timeframes.
4. Entry Conditions for Long & Short Trades
Multiple Conditions (1-6): Configure up to six independent conditions per trade direction.
Condition Types: Options include Detection, Retest, 2nd Retest, 3rd Retest, Retracement, and Break.
Timeframe Specification: Choose between "Any Timeframe", "Timeframe 1", "Timeframe 2", or "Timeframe 3".
Trade Execution Filters: Restrict trades within specific trading sessions.
5. Exit Conditions for Long & Short Trades
Exit on Opposite Signal: Automatically exit trades upon opposite trade conditions.
Exit on Session End: Closes all positions at the end of the trading session.
Multiple Take-Profit (TP) and Stop-Loss (SL) Configurations:
TP/SL based on % move, ATR, Ticks, or Fixed Price.
Hard SL option for additional risk control.
Move SL to BE (Break Even) after a certain profit threshold.
Cerca negli script per "stop loss"

Flux Charts - PAT Automation💎 GENERAL OVERVIEW
The PAT Automation is a powerful and versatile tool designed to help traders rigorously test their trading strategies against historical market data. With an array of advanced settings, traders can fine-tune their strategies, assess performance, and identify key improvements before deploying in live trading environments. This backtester offers a wide range of configurable settings, explained within this write-up.
Features of the PAT Automation:
Step By Step : Configure your strategy step by step, which will allow you to have OR & AND logic in your strategies.
Highly Configurable : Offers multiple parameters for fine-tuning trade entry and exit conditions.
Multi-Timeframe Analysis : Allows traders to analyze multiple timeframes simultaneously for enhanced accuracy.
Provides advanced stop-loss, take-profit, and break-even settings.
Incorporates volume-based conditions, liquidity grabs , order blocks , market structures and fair value gaps for refined strategy execution.
🚩 UNIQUENESS
The PAT Automation stands out from conventional backtesting tools due to its unparalleled flexibility, precision, and advanced trading logic integration. Key factors that make it unique include:
✅ Comprehensive Strategy Customization – Unlike traditional backtesters that offer basic entry and exit conditions, PAT Automation provides a highly detailed parameter set, allowing traders to fine-tune their strategies with precision.
✅ Multi-Timeframe Price Action Features – This is the first-ever tool that allows traders to backtest price action with multi-timeframe features such as Fair Value Gaps (FVGs), Inversion Fair Value Gaps (IFVGs), Order Blocks & Breaker Blocks.
✅ Customizable Take-Profit Conditions – Offers various methods to set take-profit exits, including using core features from price action, and fixed exits like ATR, % change or price change, enabling traders to tailor their exit strategies to specific market behaviors.
✅ Customizable Stop-Loss Conditions – Provides several ways to set up stop losses, including using concepts from price action and trailing stops or fixed exits like ATR, % change or price change, allowing for dynamic risk management tailored to individual strategies.
✅ Integration of External Indicators – Allows the inclusion of other indicators or data sources from TradingView for creating strategy conditions, enabling traders to enhance their strategies with additional insights and data points.
By integrating these advanced features, PAT Automation ensures that traders can rigorously test and optimize their strategies with great accuracy and efficiency.
📌 HOW DOES IT WORK?
The first setting you will want to set it the pyramiding setting. This setting controls the number of simultaneous trades in the same direction allowed in the strategy. For example, if you set it to 1, only one trade can be active in any time, and the second trade will not be entered unless the first one is exited. If it is set to 2, the script will handle both of them at the same time. Note that you should enter the same value to this pyramiding setting, and the pyramiding setting in the "Properties" tab of the script for this to work.
For deep backtesting, you can set "Max Distance To Last Bar" to "Unlimited". If you encounter any memory issues, try decreasing this setting to a lower value.
You can enable and set a backtesting window that will limit the entries to between the start date & end date.
Then, you can enter your desired settings to Price Action features like FVGs, IFVGs, Order Blocks, Breaker Blocks, Liquidity Grabs, Market Structures, EQH & EQL and Volume Imbalances. You can also enable and set up to 3 timeframes, which you can use later on when customizing your strategies enter / exit conditions.
Entry Conditions
From the "Long Conditions" or the "Short Conditions" groups, you can set your position entry conditions. For settings like "initial capital" or "order size", you can open the "Properties" tab, where these are handled.
The PAT Automation can use the following conditions for entry conditions :
1. Order Block (OB)
Detection: Triggered when an Order Block forms or is detected
Retest: Triggered when price retests an Order Block. A retest is confirmed when a candle enters an Order Block and closes outside of it.
Retracement: Triggered when price touches an Order Block
Break: Triggered when an Order Block is invalidated by candle close or wick, depending on the user's input.
2. Breaker Block (BB)
Detection: Triggered when a Breaker Block forms or is detected
Retest: Triggered when price retests a Breaker Block. A retest is confirmed when a candle enters a Breaker Block and closes outside of it.
Retracement: Triggered when price touches a Breaker Block
Break: Triggered when a Breaker Block is invalidated by candle close or wick, depending on the user's input.
3. Fair Value Gap (FVG)
Detection: Triggered when an FVG forms or is detected
Retest: Triggered when price retests an FVG. A retest is confirmed when a candle enters an FVG and closes outside of it.
Retracement: Triggered when price touches an FVG
Break: Triggered when an FVG is invalidated by candle close or wick, depending on the user's input.
4. Inversion Fair Value Gap (IFVG)
Detection: Triggered when an IFVG forms or is detected
Retest: Triggered when price retests an IFVG. A retest is confirmed when a candle enters an IFVG and closes outside of it.
Retracement: Triggered when price touches an IFVG
Break: Triggered when an IFVG is invalidated by candle close or wick, depending on the user's input.
5. Break of Structure (BOS)
Detection: Triggered when a BOS forms or is detected
6. Change of Character (CHoCH)
Detection: Triggered when a CHoCH forms or is detected
7. Change of Character Plus (CHoCH+)
Detection: Triggered when a CHoCH+ forms or is detected
8. Volume Imbalance (VI)
Detection: Triggered when a Volume Imbalance forms or is detected
9. Equal High (EQH)
Detection: Triggered when an EQH is detected
10. Equal Low (EQL)
Detection: Triggered when an EQL is detected
11. Buyside Liquidity Grab
Detection: Triggered when a liquidity grab occurs at Buyside Liquidity (BSL).
12. Sellside Liquidity Grab
Detection: Triggered when a liquidity grab occurs at Sellside Liquidity (SSL).
🕒 TIMEFRAME CONDITIONS
The PAT Automation supports Multi-Timeframe (MTF) features, just like the Price Action Toolkit. When setting an entry condition, you can also choose the timeframe.
To set up MTF conditions, navigate to the 'Timeframes' section in the settings, select your desired timeframes, and enable them. You can choose up to three timeframes.
Once you've selected your timeframes, you can use them in your strategy. When setting long and short entry / exit conditions, you can choose from Timeframe 1, Timeframe 2, or Timeframe 3.
External Conditions
Users can use external indicators on the chart to set entry conditions.
The second dropdown in the external condition settings allows you to choose a conditional operator to compare external outputs. Available options include:
Less Than or Equal To: <=
Less Than: <
Equal To: =
Greater Than: >
Greater Than or Equal To: >=
The position entry conditions work like this ;
Each side has 5 Price Action conditions and 1 Source condition. Each condition can be enabled or disabled using the checkbox on the left side.
For Price Action Conditions, you can set a direction: "Any", "Bullish" or "Bearish".
Then a Price Action Feature, like "FVG" or "Order Block".
The last part of our constructed condition is the alert type, which you can select between "Detection", "Retest", "Retracement" or "Break".
Now you should have a constructed condition, which should look like "Bullish Order Block Retest".
You can select which timeframe should this condition work on from Timeframe 1, 2 or 3. If you select "Any Timeframe", the condition will work for all timeframes.
Lastly select the step of this condition from 1 to 6.
The Source Condition
The last condition on each side is a source condition that is different from the others. Using this condition, you can create your own logic using other indicators' outputs on your chart. For example, suppose that you have an EMA indicator in your chart. You can have the source condition to something like "EMA > high".
The Step System
Each condition has a step number, and conditions are in topological order based on them.
The conditions are executed step by step. This means the condition with step 2 cannot be executed before the condition with step 1 is executed.
Conditions with the same step numbers have "OR" logic. This means that if you have 2 conditions with step 3, the condition with step 4 can trigger after only one of the step 3 conditions is executed.
➕ OTHER ENTRY FEATURES
The PAT Automation allows traders to choose when to execute trades and when not to execute trades.
1. Only Take Trades
This setting lets users specify the time period when their strategy can open or execute trades.
2. Don't Take Trades
This setting lets users specify time periods when their strategy can't open or execute trades.
↩️ EXIT CONDITIONS
1. Exit on Opposite Signal
When enabled, a long position will close when short entry conditions are met, and a short position will close when long entry conditions are met.
2. Exit on Session End
When enabled, positions will be closed at the end of the trading session.
📈 TAKE PROFIT CONDITIONS
There are several methods available for setting take profit exits and conditions.
1. Entry Condition TP
Users can use entry conditions as triggers for take-profit exits. This setting can be found under the long and short exit conditions.
2. Fixed TP
Users can set a fixed TP for exits. This setting can be found under the long and short exit conditions. Users can choose between the following:
Price: This method triggers a TP exit when price reaches a specified level. For example, if you set the Price TP to 10 and buy NASDAQ:TSLA at $190, the trade will automatically exit when the price reaches $200 ($190 + $10).
Ticks: This method triggers a TP exit when price moves a specified number of ticks.
Percentage (%): This method triggers a TP exit when price moves a specified percentage.
ATR: This method triggers a TP exit based on a specified multiple of the Average True Range (ATR).
📉 STOP LOSS CONDITIONS
There are several methods available for setting stop-loss exits and conditions.
1. Entry Condition SL
Users can use entry conditions as triggers for stop-loss exits. This setting can be found under the long and short exit conditions.
2. Fixed SL
Users can set a fixed SL for exits. This setting can be found under the long and short exit conditions. Users can choose between the following:
Price: This method triggers a SL exit when price reaches a specified level. For example, if you set the Price SL to 10 and buy NASDAQ:TSLA at $200, the trade will automatically exit when the price reaches $190 ($200 - $10).
Ticks: This method triggers a SL exit when price moves a specified number of ticks.
Percentage (%): This method triggers a SL exit when price moves a specified percentage.
ATR: This method triggers a SL exit based on a specified multiple of the Average True Range (ATR).
3. Trailing Stop
An explanation & example for the trailing stop feature is present on the write-up within the next section.
Exit conditions have the same logic of constructing conditions like the entry ones. You can construct a Take-Profit Condition & a Stop-Loss Condition. Note that the Take-Profit condition will only work if the position is in profit, regardless of if it's triggered or not. The same applies for the Stop-Loss condition, meaning that it will only work if the position is in loss.
You can also set a Fixed TP & Fixed SL based on the price movement after the position is entered. You have options like "Price", "Ticks", "%", or "Average True Range". For example, you can set a Fixed TP like "5%", and the position will be entered once it moves 5% up in a long position.
Trailing Stop
For the Fixed SL, you also have a "Trailing" stop option, which you can set it's activation level as well. The Trailing stop activation level and it's value are expressed in ticks. Check this scenerio for an example :
We have a ticker with a tick value of $1. Our Trailing Stop is set to 10 ticks and activation level is set to 30 ticks.
We buy 1 contract when the price is $100.
When the price becomes $110, we are in $10 (10 ticks) profit and the trailing stop is now activated.
The current price our stop's on is $110 - $30 (30 ticks), which is the level of $80.
The trailing stop will only move if the price moves up the highest high the price has been after we entered the position.
Let's suppose that price moves up $40 right after our trailing stop is activated. The price will now be $150, and our trailing stop will sit on $150 - $30 (30 ticks) = $120.
If the price is down the $120 level, our stop loss will be triggered.
There is also a "Hard SL" option designed for a backup stop-loss when trailing stops are enabled. You can enable & set this option and if the price goes down before our trailing stop even activates, the position will be exited.
You can also move stop-loss to the break-even (entry price of the position) after a certain profit is achieved using the last setting of the exit conditions. Note that for this to work, you will need to have a Fixed SL set-up.
➕ OTHER EXIT FEATURES
1. Move Stop Loss to Breakeven
This setting allows the strategy to automatically move the SL to Breakeven (BE) when the position is in profit by a certain amount. Users can choose between the following:
Price: This method moves the SL to BE when price reaches a specified level.
Ticks: This method moves the SL to BE when price moves a specified number of ticks.
Percentage (%): This method moves the SL to BE when price moves a specified percentage.
ATR: This method moves the SL to BE when price moves a specified multiple of the Average True Range (ATR).
Example Entry Scenario
To give an example , check this scenario; out conditions are :
LONG CONDITIONS
Bullish Order Block Detection, Step 1
Bullish CHoCH Detection, Step 2
Bullish Volume Imbalance Detection, Step 2
Bullish IFVG Retest, Step 3
First, the strategy needs to detect a Bullish Order Block in order to start working.
After it's detected, now it's looking for either a CHoCH, or a Volume Imbalance to proceed to the next step, the reason for this is that they both have the same step number.
After one of them is detected, the strategy will consistently check all IFVGs for a retest. If the retest occurs, a long position will be entered.
⏰ ALERTS
This indicator uses TradingView's strategy alert system. All entries and exits will be sent as an alert if configured. It's possible to further customize these alerts to your liking. For more information check TradingView's strategy alert customization page: www.tradingview.com
⚙️ SETTINGS
1. Backtesting Settings
Pyramiding: Controls the number of simultaneous trades allowed in the strategy. This setting must have the same value that is entered on the script's properties tab on the settings pane.
Max Distance to Last Bar: Determines the depth of historical data used to prevent memory overload.
Enable Custom Backtesting Period: Restricts backtesting to a specific date range.
Start & End Time Configuration: Define precise start and end dates for historical analysis.
2. Fair Value Gaps Settings
Zone Invalidation: Select between "Wick" and "Close" invalidation.
Filtering: Choose between "Average Range" and "Volume Threshold".
FVG Sensitivity: Ranges from Extreme to Low to detect FVGs with varying strictness.
Allow Gaps: Enables analysis on tickers that have different open-close price gaps.
3. Inversion Fair Value Gaps Settings
Zone Invalidation: Choose between "Wick" and "Close".
4. Order Block Settings
Swing Length: Adjusts the minimum number of bars required for OB formation.
Zone Invalidation Method: Select between "Wick" and "Close".
5. Breaker Block Settings
Zone Invalidation: Set invalidation method as "Wick" or "Close".
6. Liquidity Grabs Settings
Pivot Length: Adjusts the number of bars used to detect liquidity grabs.
Wick-Body Ratio: Defines the proportion of wick-to-body size for liquidity grab detection.
7. Multi-Timeframe Analysis
Enable Up to Three Timeframes: Select and analyze trades across multiple timeframes.
8. Market Structures
Swing Length: Defines the number of bars required for structure shifts.
Includes BOS, CHoCH, CHoCH+ Detection.
9. Equal Highs & Lows
ATR Multiplier: Defines the sensitivity of equal highs/lows detection.
10. Volume Imbalances
Gap Size Sensitivity: Ranges from "Ultra" to "Low".
Disable Overnight Gaps: Filters out volume imbalances occurring due to overnight gaps.
11. Entry Conditions for Long & Short Trades
Multiple Conditions (1-6): Configure up to six independent conditions per trade direction.
Condition Types: Options include Detection, Retest, Retracement, and Break.
Timeframe Specification: Choose between "Any Timeframe", "Timeframe 1", "Timeframe 2", or "Timeframe 3".
Trade Execution Filters: Restrict trades within specific trading sessions.
12. Exit Conditions for Long & Short Trades
Exit on Opposite Signal: Automatically exit trades upon opposite trade conditions.
Exit on Session End: Closes all positions at the end of the trading session.
Multiple Take-Profit (TP) and Stop-Loss (SL) Configurations:
TP/SL based on % move, ATR, Ticks, or Fixed Price.
Hard SL option for additional risk control.
Move SL to BE (Break Even) after a certain profit threshold.

Triple EMA Crossover StrategyTriple EMA Crossover Strategy
Overview
The Triple EMA Crossover Strategy is a trend-following trading system that utilizes three Exponential Moving Averages (EMAs) to identify potential entry and exit points in the market. This strategy is based on the principle that when shorter-term prices cross above longer-term prices, it can indicate a bullish trend, and conversely when they cross below, it can signal a bearish trend.
Components
Exponential Moving Averages (EMAs):
Short EMA: A fast-moving average that reacts quickly to price changes (commonly set to 9 periods).
Medium EMA: A medium-term average that smooths out price data and helps confirm trends (commonly set to 21 periods).
Long EMA: A slow-moving average that helps identify the overall trend direction (commonly set to 55 periods).
Trading Signals:
Buy Signal: A long entry is triggered when:
The Short EMA (9) crosses above the Medium EMA (21).
The Medium EMA (21) is above the Long EMA (55).
Sell Signal: A short entry is signaled when:
The Short EMA (9) crosses below the Medium EMA (21).
The Medium EMA (21) is below the Long EMA (55).
Stop Loss and Take Profit:
Stop Loss: Implement a predefined percentage or ATR-based stop loss to limit potential losses.
Take Profit: Set a target based on a risk-to-reward ratio that reflects your trading strategy's goals.
Advantages
Trend Identification: The EMA crossover system allows traders to identify the current trend dynamically, focusing on upward or downward price movements.
Simplicity: The strategy is straightforward, making it accessible for both new and experienced traders.
Flexibility: This method can be applied across multiple timeframes and asset classes, making it versatile for various trading styles.
Disadvantages
Lagging Indicator: Moving averages are lagging indicators, meaning signals may come later than the actual price movement, which can lead to missed opportunities.
Whipsaw Effect: In ranging markets, the strategy may produce false signals leading to potential losses.

ETH Signal 15m
This strategy uses the Supertrend indicator combined with RSI to generate buy and sell signals, with stop loss (SL) and take profit (TP) conditions based on ATR (Average True Range). Below is a detailed explanation of each part:
1. General Information BINANCE:ETHUSDT.P
Strategy Name: "ETH Signal 15m"
Designed for use on the 15-minute time frame for the ETH pair.
Default capital allocation is 15% of total equity for each trade.
2. Backtest Period
start_time and end_time: Define the start and end time of the backtest period.
start_time = 2024-08-01: Start date of the backtest.
end_time = 2054-01-01: End date of the backtest.
The strategy will only run when the current time falls within this specified range.
3. Supertrend Indicator
Supertrend is a trend-following indicator that provides buy or sell signals based on the direction of price changes.
factor = 2.76: The multiplier used in the Supertrend calculation (increasing this value makes the Supertrend less sensitive to price movements).
atrPeriod = 12: Number of periods used to calculate ATR.
Output:
direction: Determines the buy/sell direction based on Supertrend.
If direction decreases, it signals a buy (Long).
If direction increases, it signals a sell (Short).
4. RSI Indicator
RSI (Relative Strength Index) is a momentum indicator, often used to identify overbought or oversold conditions.
rsiLength = 12: Number of periods used to calculate RSI.
rsiOverbought = 70: RSI level considered overbought.
rsiOversold = 30: RSI level considered oversold.
5. Entry Conditions
Long Entry:
Supertrend gives a buy signal (ta.change(direction) < 0).
RSI must be below the overbought level (rsi < rsiOverbought).
Short Entry:
Supertrend gives a sell signal (ta.change(direction) > 0).
RSI must be above the oversold level (rsi > rsiOversold).
The strategy will only execute trades if the current time is within the backtest period (in_date_range).
6. Stop Loss (SL) and Take Profit (TP) Conditions
ATR (Average True Range) is used to calculate the distance for Stop Loss and Take Profit based on price volatility.
atr = ta.atr(atrPeriod): ATR is calculated using 12 periods.
Stop Loss and Take Profit are calculated as follows:
Long Trade:
Stop Loss: Set at close - 4 * atr (current price minus 4 times the ATR).
Take Profit: Set at close + 2 * atr (current price plus 2 times the ATR).
Short Trade:
Stop Loss: Set at close + 4 * atr (current price plus 4 times the ATR).
Take Profit: Set at close - 2.237 * atr (current price minus 2.237 times the ATR).
Summary:
This strategy enters a Long trade when the Supertrend indicates an upward trend and RSI is not in the overbought region. Conversely, a Short trade is entered when Supertrend signals a downtrend, and RSI is not oversold.
The trade is exited when the price reaches the Stop Loss or Take Profit levels, which are determined based on price volatility (ATR).
Disclaimer:
The content provided in this strategy is for informational and educational purposes only. It is not intended as financial, investment, or trading advice. Trading in cryptocurrency, stocks, or any financial markets involves significant risk, and you may lose more than your initial investment. Past performance is not indicative of future results, and no guarantee of profit can be made. You should consult with a professional financial advisor before making any investment decisions. The creator of this strategy is not responsible for any financial losses or damages incurred as a result of following this strategy. All trades are executed at your own risk.

Pullback_Power [JackTz]Welcome to Pullback_Power
Pullback_Power is a scalping strategy designed to capitalize on market retracements while incorporating unique dynamic features to enhance profitability.
Calculation
Pullback_Power purely uses moving averages to calculate both entry and exits. Exits can also be set to fixed percentages for both take profit and stop loss.
How the Strategy Works
Statistics show that markets normally do a recovery after each drop. Crypto markets can easily drop up to 20% within a few hours and then do a complete or partial recovery. Pullback_Power utilizes this known pattern alongside pyramiding. The strategy aims to catch one or more entries when the price drops, hoping to make profits when the market recovers from the drop. The fixed take profit and stop loss can be used to define your risk management, while the dynamic exit opportunity is riskier but provides the ability to stay in the trade longer while it recovers. Pullback_Power can make up to four entries. This means it utilizes pyramiding to spread out the entry points, but every exit is a full exit. It is not possible to partially exit.
Utility
Pullback_Power is a scalping strategy suitable for traders who operate with small trades and don't want to stay in the market for too long. Pullback_Power offers precise signals with no repainting. The strategy thrives in volatility, so crypto pairs might yield the best results, although this strategy can be adapted to work on all pairs and markets.
How to Automate It
Pullback_Power utilizes the standard placeholders of strategies on TradingView. This enables the trader to add every data point into a webhook, making it fully flexible to suit every trader's needs. To automate, create an alert, set the webhook URL, and add the JSON body needed for the webhook. An example of a simple JSON webhook with some of the standard strategy placeholders:
{
"side": "{{strategy.order.action}}",
"symbol": "{{ticker}}",
"amount": "{{strategy.order.contracts}}"
}
Read about all the standard placeholders that you can use here: TradingView - Standard strategy placeholders
Originality
Pullback_Power is unique in its ability to create precise signals without repainting while maintaining a solid approach to the pullback strategy. Its simplicity not only makes the strategy easy to use and understand but also highly effective. The simplicity reduces inputs, eliminating overfitting and limits each input to avoid incorrect usage. Many times, default settings are enough to achieve good backtesting results on almost all pairs available. Pullback_Power also differs from many other strategies by its solid code, which enhances performance and provides more reliable backtesting. The clean code increases the resilience and precision of the entries, making it less prone to errors.
Many pullback/scalping strategies normally only works on specific scopes of timeframes or pairs. Pullback_Power can easily be adapted to work on almost every scenario. The biggest change needed is the length of the moving average. The lower the timeframe, the higher a length is needed for proper results. I.e. on a 2H timeframe a length of 3 can yield good results. On a 5min timeframe the length might need to be as high as 70.
How to Use
To use Pullback_Power, add the script to your trading chart. By default, Pullback_Power opens four orders to optimize trade opportunities with a default fee value set at 0.1%. You can change these default settings in the Settings window under the Properties tab. To tailor Pullback_Power to your individual trading style, navigate to the Settings under the Input tab. Here you can configure various inputs to fit your trading style.
- Backtest settings , Start Date:
Defines the date of when the calculation starts. Use this to set the date of when the first trade could potentially emit.
- Backtest settings , End Date:
Defines the date of when the calculation ends. If there are any open trades after this date the close calculations are still live. It only makes sure that new orders cannot be opened after this date.
- Backtest settings , Only trade on weekdays:
This is a toggle you can enable or disable. If enabled it only allows new entries to happen during the normal week days, meaning Monday, Tuesday, Wednesday, Thursday and Friday.
Disable this to enable the script to open trades on all 7 days of the week.
- Open settings , Use dynamic long positions:
This toggle allows you to enable or disable the pullback level calculations after first trade.
If enabled, the calculations of level 2, 3 and 4 continues to happen after each bar, making the levels follow the price with the moving averages calculations.
If disabled, the calculations of the levels stop after the first trade. This means that the levels calculation at the point of the first trade stay fixed until all trades are closed.
You can see the difference of the green lines on the chart when you toggle this flag.
- Open settings , Data type:
This is the bar data used for the moving average calculation when opening trades. The possible data types are Open, High, Low, Close, HL2, HLC3, OHLC4, OC2 and HC2.
- Open settings , Source type:
This is the source used to calculate the moving average. The types available are: SMA, PCMA, EMA, WMA, DEMA, ZLEMA and HMA.
- Open settings , Length:
This is the length used for the moving average calculations. 3 means it takes the last 3 bars of historical data for the calculation.
- Open settings , Offset:
This defines if the calculation should use an offset for the historical data. This does not use a look-forward feature, but a look-backward feature. To prevent any possible repaints the offset can only be positive, not negative.
For instance, if the length is 3 and the offset is 0 the calculation is made from the last 3 bars, making it bar1, bar2 and bar3. If the length is 3 and the offset is 1 the calculation is made from bar2, bar3, and bar4 – offsetting the calculation by 1 bar.
- Leverage settings , Leverage liquidation (1-125):
The script itself does not handle any custom leverage calculation – this must be done in the Properties tabs and increasing the order size.
This setting is made to test a possible liquidation event if using leverage.
By setting this to higher than 1, a red line is visible after the first trade on the chart. This indicates the liquidation price.
If this setting is set to 25, the script will calculate the liquidation price from a x25 leverage. If this price is hit, the scripts stops emitting any orders and the background turns red.
You can use this to test if your settings could handle a certain level of leverage.
- Pullback settings , Pullback 1, 2, 3 and 4:
Each of these settings defines the entry price of each pullback level. If Pullback 1 is set to -6 it means that the moving average calculation should be 6% lower than the actual price.
The same logic applies to Pullback 2, 3 and 4.
Setting any level to 0 will disable the level – eliminating any orders to emit on that level.
This can be used to change the level of pyramiding down from 4 if needed.
If you do this, remember to also change the order size and the pyramiding value in the Properties tab accordingly.
- Close settings , Use dynamic TP and SL:
If enabled, script will exit all orders using the same but separate algorithm for moving averages. This enables the user to define if you want the orders to be closed if the price level of this moving average is hit. The price level for this calculation is visible on the chart by the blue line.
Although you can change the length and offset, as described underneath, this calculation uses the same data and source type defined in the Open settings area.
- Close settings , Length, Close:
This is the length used for the closing moving average calculations. 3 means it takes the last 3 bars of historical data for the calculation.
- Close settings , Offset, Close:
This defines if the calculation for the closing moving average should use an offset for the historical data. Just as the offset used for opening order, this does not use a look-forward feature, but a look-backward feature. To prevent any possible repaints the offset can only be positive, not negative.
For instance, if the length is 3 and the offset is 0 the calculation is made from the last 3 bars, making it bar1, bar2 and bar3. If the length is 3 and the offset is 1 the calculation is made from bar2, bar3, and bar4 – offsetting the calculation by 1 bar.
- Close settings , Use TakeProfit:
This toggle enables/disables a fixed take profit percentage.
- Close settings , TP %:
This sets the wanted % to reach on a take profit. This setting is ignored if the toggle above is disabled.
- Close settings , Use StopLoss:
This toggle enables/disables a fixed stop loss percentage.
- Close settings , SL %:
This sets the wanted % to reach on a stop loss. This setting is ignored if the toggle above is disabled.
Exit on Same Bar as Entry
By default, the script doesn't emit any exit orders on the same bar as the first entry order. Enable "Recalculation: After order is filled" to change this behavior.
Troubleshooting
While Pullback_Power is designed to provide reliable trading signals, you may encounter rare issues. One such issue could be receiving an error message stating "can't open orders with 0 or negative qty." If you encounter this error, it is likely due to specific conditions on the selected timeframe. To resolve this issue, change the timeframe on your trading chart.
Underlying Principles and Value Proposition
Pullback_Power leverages moving averages and volatility behavior to identify market retracements and capitalize on them. The strategy is rooted in the understanding that markets often experience temporary reversals or "pullbacks" before resuming their primary trend. By identifying these pullbacks and entering trades at opportune moments, Pullback_Power aims to capture quick profits from short-term market movements.
The dynamic and fixed calculations of Take Profit (TP) and Stop Loss (SL) levels enhances risk management, ensuring that potential losses are controlled while allowing room for profits to grow. The adaptive approach using the moving averages considers current market conditions, making the strategy flexible and responsive to changing volatility.
Moreover, Pullback_Power's non-repainting nature ensures the reliability of its signals, eliminating hindsight bias and providing traders with actionable insights based on real-time market data.
The strategy's simplicity and effectiveness make it accessible for traders of all experience levels. Whether you're a beginner looking to start scalping or an experienced trader seeking to diversify your trading approach, Pullback_Power offers a balanced blend of simplicity and sophistication to help you navigate the markets with confidence.
By focusing on clear, transparent principles and offering practical tools for risk management, Pullback_Power aims to provide tangible value to traders, empowering them to make informed decisions and optimize their trading outcomes.
Thank you for choosing Pullback_Power. I wish you successful trading!

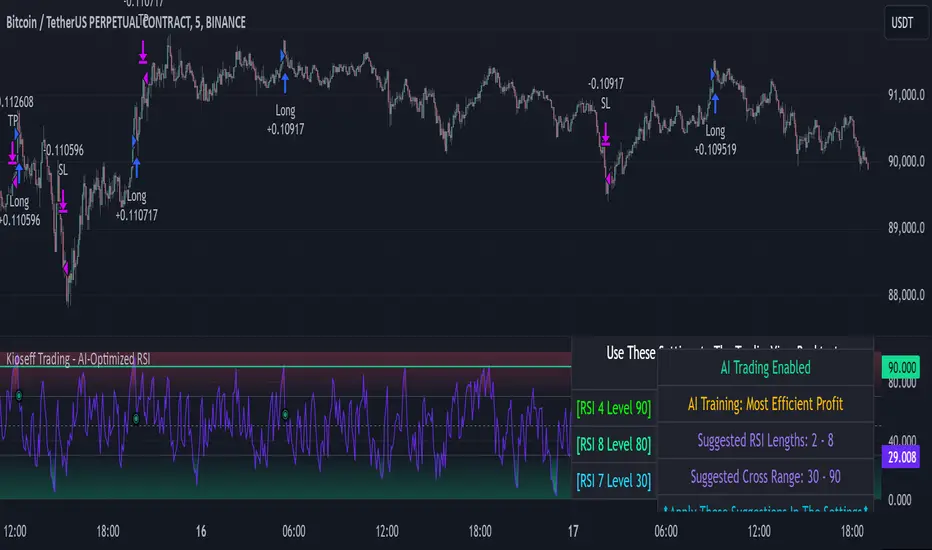
Kioseff Trading - AI-Optimized RSIAI-Optimized RSI
Introducing AI-Optimized RSI: a streamlined solution for traders of any skill level seeking to rapidly test and optimize RSI. Capable of analyzing thousands of strategies, this tool cuts through the complexity to identify the most profitable, reliable, or efficient approaches.
Paired with TradingView's native backtesting capabilities, the AI-Optimized RSI learns from historical performance data. Set up is easy for all skill levels, and it makes fine-tuning trading alerts and RSI straightforward.
Features
Purpose : Uncover optimal RSI settings and entry levels with precision. Say goodbye to random guesses and arbitrary indicator use—this tool provides clear direction based on data.
Target Performance : You set the goal, and AI-RSI seeks it out, whether it's maximizing profits, efficient trading, or achieving the highest win rate.
AI-Powered : With intelligent AI recommendations, the tool dynamically fine-tunes your RSI approach, steering you towards ideal strategy performance.
Rapid Testing : Evaluate thousands of RSI strategies.
Dual Direction : Perfect both long and short RSI strategies with equal finesse.
Deep Insights : Access detailed metrics including profit factor, PnL, win rate, trade counts, and more, all within a comprehensive strategy script.
Instant Alerts : Set alerts and trade.
Full Customization : Test and optimize all RSI settings, including cross levels, profit targets and stop losses.
Simulated Execution : Explore the impact of limit orders and other trade types through simulation.
Integrative Capability : Combine your own custom indicators or others from the TradingView community for a personalized optimization experience.
Flexible Timeframes : Set your optimization and backtesting to any date range.
Key Settings
The image above shows explanations for a list of key settings for the optimizer.
Direction : This setting controls trade direction: Long or Short.
Entry Condition : Define RSI entry: Select whether to trigger trades on RSI crossunders or crossovers.
RSI Lengths Range : Choose the range of RSI periods to test and find the best one.The AI will find the best RSI period for you.
RSI Cross Range : Set the range for RSI levels where crosses trigger trade signals. The AI will find the best level for you.
Combinations : Select how many RSI strategies to compare.
Optimization Type : Choose the goal for optimization and the AI: profit, win rate, or efficiency.
Profit Target : Set your profit target with this setting.
Stop Loss : Decide your maximum allowable loss (stop loss) per trade.
Limit Order : Specify whether to include limit orders in the strategy.
Stop Type : Choose your stop strategy: a fixed stop loss or a trailing stop.
How to: Find the best RSI for trading
It's important to remember that merely having the AI-Optimized RSI on your chart doesn't automatically provide you with the best strategy. You need to follow the AI's guidance through an iterative process to discover the optimal RSI settings and strategy.
1.Starting Your Strategy Setup
Begin by deciding your goals for each trade: your profit target and stop loss. You'll also choose how to manage your stops – whether they stay put (fixed) or move with the price (trailing), and whether you want to exit trades at a specific price (limit orders). Keep the initial settings for RSI lengths and cross ranges at their default to give the tool a broad testing field. The AI's guidance will refine these settings to pinpoint the most effective ones through a process of comprehensive testing.
The image above shows our chart prior to any optimization efforts.
Note: the settings shown above in the key settings section will be used to start our demonstration.
2. Follow AI’s suggestions
Optimization Prompt: After loading your strategy, the indicator will prompt you to change the RSI length range and RSI level range to a better performing range.
Continue changing the RSI length range and RSI level range to match the indicator's suggestions until "Best Found" is displayed!
The image above shows results after we applied the tool’s suggestions. New suggestions have appeared, and we will continue to apply them.
Continue to adjust settings as recommended by the optimizer. If no better options are found, the optimizer will suggest increasing the number of combinations. Repeat this process until the optimizer indicates that the optimal setting has been identified.
Success! With the "Best Found" notification, an optimized RSI is now active. The AI will keep refining the strategy based on ongoing performance, ensuring continuous optimization.
AI Mode
AI Mode incorporates Heuristic-Based Adaptive Learning to fine-tune trading strategies in a continuous manner. This feature consists of two main components:
Heuristic-Based Decision Making: The algorithm evaluates multiple RSI-based trading strategies using specific metrics such as Profit and Loss (PNL), Win Rate, and Most Efficient Profit. These metrics act as heuristics to assist the algorithm in identifying suitable strategies for trade execution.
Online Learning: The algorithm updates the performance evaluations of each strategy based on incoming market data. This enables the system to adapt to current market conditions.
Incorporating both heuristic-based decision-making and online learning, this feature aims to provide a framework for trading strategy optimization.
Settings
AI Mode Aggressiveness:
Description: The "AI Mode Aggressiveness" setting allows you to fine-tune the AI's trading behavior. This setting ranges from “Low” to “High”, with “High” indicating a more assertive trading approach.
Functionality: This feature filters trading strategies based on a proprietary evaluation method. A higher setting narrows down the strategies that the AI will consider, leaning towards more aggressive trading. Conversely, a lower setting allows for a more conservative approach by broadening the pool of potential strategies.
Adaptive Learning Aggressiveness:
Description: When Adaptive Learning is enabled, the "Adaptive Learning Aggressiveness" setting controls how dynamically the AI adapts to market conditions using selected performance metrics.
Functionality: This setting impacts the AI's responsiveness to shifts in strategy performance. By adjusting this setting, you can control how quickly the AI moves away from strategies that may have been historically successful but are currently underperforming, towards strategies that are showing current promise.
Optimization
Trading system optimization is immensely advantageous when executed with prudence.
Technical-oriented, mechanical trading systems work when a valid correlation is methodical to the extent that an objective, precisely-defined ruleset can consistently exploit it. If no such correlation exists, or a technical-oriented system is erroneously designed to exploit an illusory correlation (absent predictive utility), the trading system will fail.
Evaluate results practically and test parameters rigorously after discovery. Simply mining the best-performing parameters and immediately trading them is unlikely a winning strategy. Put as much effort into testing strong-performing parameters and building an accompanying system as you would any other trading strategy. Automated optimization involves curve fitting - it's the responsibility of the trader to validate a replicable sequence or correlation and the trading system that exploits it.
Script a pagamento
Kioseff Trading - AI-Optimized Supertrend
AI-Optimized Supertrend
Introducing AI-Optimized Supertrend: a streamlined solution for traders of any skill level seeking to rapidly test and optimize Supertrend. Capable of analyzing thousands of strategies, this tool cuts through the complexity to identify the most profitable, reliable, or efficient approaches.
Paired with TradingView's native backtesting capabilities, the AI-Optimized Supertrend learns from historical performance data. Set up is easy for all skill levels, and it makes fine-tuning trading alerts and Supertrend straightforward.
Features
Rapid Supertrend Strategy Testing : Quickly evaluate thousands of Supertrend strategies to find the most effective ones.
AI-Assisted Optimization : Leverage AI recommendations to fine-tune strategies for superior results.
Multi-Objective Optimization : Prioritize Supertrend based on your preference for the highest win rate, maximum profit, or efficiency.
Comprehensive Analytics : The strategy script provides an array of statistics such as profit factor, PnL, win rate, trade counts, max drawdown, and an equity curve to gauge performance accurately.
Alerts Setup : Conveniently set up alerts to be notified about critical trade signals or changes in performance metrics.
Versatile Stop Strategies : Experiment with profit targets, trailing stops, and fixed stop losses.
Binary Supertrend Exploration : Test binary Supertrend strategies.
Limit Orders : Analyze the impact of limit orders on your trading strategy.
Integration with External Indicators : Enhance strategy refinement by incorporating custom or publicly available indicators from TradingView into the optimization process.
Key Settings
The image above shows explanations for a list of key settings for the optimizer.
Set the Factor Range Limits : The AI suggests optimal upper and lower limits for the Factor range, defining the sensitivity of the Supertrend to price fluctuations. A wider range tests a greater variety, while a narrower range focuses on fine-tuning.
Adjust the ATR Range : Use the AI's recommendations to establish the upper and lower bounds for the Average True Range (ATR), which influences the Supertrend's volatility threshold.
ATR Flip : This option lets you interchange the order of ATR and Factor values to quicky test different sequences, giving you the flexibility to explore various combinations and their impact on the Supertrend indicator's performance.
Strategies Evaluated : Adjust this setting to determine how many Supertrend strategies you want to assess and compare.
Enable AI Mode : Turn this feature on to allow the AI to determine and employ the optimal Supertrend strategy with the desired performance metric, such as the highest win rate or maximum profitability.
Target Metric : Adjust this to direct the AI towards optimizing for maximum profit, top win rates, or the most efficient profits.
AI Mode Aggressiveness : Set how assertively the AI pursues the chosen performance goal, such as highest profit or win rate.
Strategy Direction : Choose to focus the AI's testing and optimization on either long or short Supertrend strategies.
Stop Loss Type : Specify the stop loss approach for optimization—fixed value, a trailing stop, or Supertrend direction changes.
Limit Order : Decide if you want to execute trades using limit orders for setting your profit targets, stop losses, or apply them to both.
Profit Target : Define your desired profit level when using either a fixed stop loss or a trailing stop.
Stop Loss : Define your desired stop loss when using either a fixed stop loss or a trailing stop.
How to: Find the best Supertrend for trading
It's important to remember that merely having the AI-Optimized Supertrend on your chart doesn't automatically provide you with the best strategy. You need to follow the AI's guidance through an iterative process to discover the optimal Supertrend settings and strategy.
Optimizing Supertrend involves adjusting two key parameters: the Factor and the Average True Range (ATR). These parameters significantly influence the Supertrend indicator's sensitivity and responsiveness to price movements.
Factor : This parameter multiplies the ATR to determine the distance of the Supertrend line from the price. Higher values will create a wider band, potentially leading to fewer trade signals, while lower values create a narrower band, which may result in more signals but also more noise.
ATR (Average True Range) : ATR measures market volatility. By using the ATR, the Supertrend adapts to changing market volatility; a higher ATR value means a more volatile market, so the Supertrend adjusts accordingly.
During the optimization process, these parameters are systematically varied to determine the combination that yields the best performance based on predefined criteria such as profitability, win rate, or risk management efficiency. The optimization aims to find the optimal Factor and ATR settings.
1.Starting Your Strategy Setup
Begin by deciding your goals for each trade: your profit target and stop loss, or if all trades exit when Supertrend changes direction. You'll also choose how to manage your stops – whether they stay put (fixed) or move with the price (trailing), and whether you want to exit trades at a specific price (limit orders). Keep the initial settings for Supertrend Factor Range and Supertrend ATR Range at their default to give the tool a broad testing field. The AI's guidance will refine these settings to pinpoint the most effective ones through a process of comprehensive testing.
Demonstration Start: We'll begin with the settings outlined in the key settings section, using Supertrend's direction change to the downside as our exit signal for all trades.
2. Continue applying the AI’s suggestions
Keep updating your optimization settings based on the AI's recommendations. Proceed with this iterative optimization until the "Best Found" message is displayed, signaling that the most effective strategy has been identified.
While following the AI's suggestions, we've been prompted with a new suggestion: increase the
number of strategies evaluated. Keep following the AI's new suggestions to evaluate more strategies. Do this until the "Best Found" message shows up.
Success! We continued to follow the AI’s suggestions until “Best Found” was indicated!
AI Mode
AI Mode incorporates Heuristic-Based Adaptive Learning to fine-tune trading strategies in a continuous manner. This feature consists of two main components:
Heuristic-Based Decision Making: The algorithm evaluates multiple Supertrend-based trading strategies using metrics such as Profit and Loss (PNL), Win Rate, and Most Efficient Profit. These metrics act as heuristics to assist the algorithm in identifying suitable strategies for trade execution.
Online Learning: The algorithm updates the performance evaluations of each strategy based on incoming market data. This enables the system to adapt to current market conditions.
Incorporating both heuristic-based decision-making and online learning, this feature aims to provide a framework for trading strategy optimization.
AI Mode Settings
AI Mode Aggressiveness:
Description: The "AI Mode Aggressiveness" setting allows you to fine-tune the AI's trading behavior. This setting ranges from “Low” to “High”, with “High” indicating a more assertive trading approach.
Functionality: This feature filters trading strategies based on a proprietary evaluation method. A higher setting narrows down the strategies that the AI will consider, leaning towards more aggressive trading. Conversely, a lower setting allows for a more conservative approach by broadening the pool of potential strategies.
Optimization
Trading system optimization is immensely advantageous when executed with prudence.
Technical-oriented, mechanical trading systems work when a valid correlation is methodical to the extent that an objective, precisely-defined ruleset can consistently exploit it. If no such correlation exists, or a technical-oriented system is erroneously designed to exploit an illusory correlation (absent predictive utility), the trading system will fail.
Evaluate results practically and test parameters rigorously after discovery. Simply mining the best-performing parameters and immediately trading them is unlikely a winning strategy. Put as much effort into testing strong-performing parameters and building an accompanying system as you would any other trading strategy. Automated optimization involves curve fitting - it's the responsibility of the trader to validate a replicable sequence or correlation and the trading system that exploits it.
Script a pagamento

[Fedra Algotrading Strategy Trailing Stop Version]Simpler version of my popular strategy.Optimized for cryptocurrencies. Originally conceived to trade automatically through bots (that's how I use it), it also works to get signals and trade manually in any exchange.
It works in spot.
Buy the dip:
Attempts to buy on the dip, finding entries when the price makes abrupt dips that break deviation of the linear regression of the last periods.
Trend Detection:
Determines whether the market is in an uptrend or downtrend by crossing 2 SMAs + super trend in different temporalities. This affects the performance of the strategy. It works as a filter to avoid making entries in a downtrend.
% Trailing Stop Loss. The Stop Loss is placed a % below the price and accompanies it in the rises to make the most of an uptrend.
Optionally, you can set up a percentage Take Profit
It allows you to easily configure the backtest period to optimize the parameters for consistent results.
The strategy calculates by default a commission of 0.1% on each trade to make the backtest more "pessimistic".
Includes advanced features for compatibility with different bots platforms in the market.
Risk management by % of equity or by maximum series of losses.
////////////////////////////
Versión más simple de mi popular estrategia, optimizada para criptomonedas. Originalmente concebida para operar automáticamente a través de bots (así es como la uso yo), también funciona para obtener señales y operar manualmente en cualquier exchange.
Funciona en spot.
Compra en la caída:
Intenta comprar en la caída, encontrando entradas cuando el precio hace caídas abruptas que rompen la desviación de la regresión lineal de los últimos períodos.
Detección de tendencia:
Determina si el mercado está en tendencia alcista o bajista mediante el cruce de 2 SMAs + super trend en diferentes temporalidades. Esto afecta al rendimiento de la estrategia. Funciona como un filtro para evitar hacer entradas en contra de la tendencia del mercado.
% Trailing Stop Loss. El Stop Loss se coloca un % por debajo del precio y lo acompaña en las subidas para aprovechar una tendencia alcista.
Opcionalmente, se puede establecer un porcentaje de Take Profit
Permite configurar fácilmente el periodo de backtest para optimizar los parámetros y obtener resultados consistentes.
La estrategia calcula por defecto una comisión del 0,1% en cada operación para que el backtest sea más "pesimista".
Incluye características avanzadas para la compatibilidad con diferentes plataformas de bots en el mercado.
Gestión del riesgo por % del capital o por serie máxima de pérdidas.

BNBUSD 1 Minute Chart / 1 Hour BBand Day Trading 3Commas*** As always, this is provided for educational purposes only and I am not an investment advisor; I'm just a guy who likes to come up with novel ideas and share them with other traders so they can learn. ***
This strategy is a fun one. I took parts of 'Bollinger Awesome Alert R1 by JustUncleL' () and modified it to have enhanced day trading functionality. This version does not show source and that is by design - I want the alerts to be visible to the public and if you want to get set up with a version that integrates with 3commas, drop me a message - there's a lot more that goes into setting up automated 3commas trading but this script was written specifically with 3commas in mind.
It's possible this is one of the more interesting strategy indicators I've made. The setup I used for this is as such and you will need to set it up the same way:
One minute chart for the BNB/USD(T) pair on Binance.us (other exchanges will likely work, other coin pairs or other time frames will likely not)
This script watches the one minute chart and when price golden crosses the lower Bollinger band, a buy order is placed.
There are two sell conditions; one I set up to take profit and one I designed as a kind of stop loss. I went with a flat 7.5% for the take profit as this showed the best results in the backtester. I had planned for it to be closer to 3% but for this strategy to work it needs to be higher. According to the backtest it offers around double the return of buying and holding BNB over the sample timeframe.
The 'stop loss' condition is where the fun lies. I transposed Bollinger bands from a one hour BNBUSD Binance.us chart on top of the 1 minute chart and those are the blue lines you see. The stop loss condition happens when the current price death crosses the bottom one hour Bollinger band. Ironically, often this doesn't result in any losses as you will see in the chart and instead results in a small win. This definitely was not my intention when I created it but it's a lot better than the earlier version where I set up a variable percentage-based stop loss. Even with me optimizing the regular stop loss for this coin pair, my 1 hour bband method nets an extra 2% profit over the same two week time period, even with Binance fees factored in!
Have fun and like I said, hmu via message if you want access to the customizable indicator for 3commas!

Dankland Playground DCAing multi-strategy OPThis is essentially a script that I made for myself before deciding it may be good enough for you all as well.
How it works basically is this... you have 18 oscillators which can all be used as independently as you wish. That means there are 20 groups which they can be split amongst as you choose.
When in separate groups they should not be able to sell eachothers positions without triggering a stop loss. Every single oscillator has its own position sizing and exit sizing which can be stated as either a percent of balance or a flat amount of contracts. Each oscillator has a minimum amount of profit you can tell it to sell it, which is calculated from the average cost of your current position, which does include all groups. This works out to help you average out better entry and exit prices, essentially a method of DCAing.
You can set the minimum sale amount, which is to keep it from placing orders below your exchanges minimum dollar trade cost.
The included oscillators are as follows:
Chande Momentum cross
Moving Average Cross
MACD cross
%B Bollinger cross
Stochastic cross + region filter
Stochastic RSI cross + region filter
SMII cross and region
Three RMIs
Standard RSI
LSMA-smoothed RSI
Know Sure Thing
RSI of KST
Coppock Curve
RSI of Curve
PPO
RSI of PPO
Trix
RSI of Trix
So the idea is that this is essentially multiple strategies combined into one backtestable house. Balance is calculated for all position sizes in order to try to prevent false entries that plague so many scripts (IE, you set pyramiding to 2, each buy $1000, initial balance $1000, and yet it buys two orders off the bat for $2000 total and nets 400% profit because the second was considered free)/
You tune each side and position size them so that they work together as well as you can and in doing so you are able to create a single backtest that is capable of running a bot, essentially, between multiple strategies - you can run a slower Moving Average cross, a faster SMI cross or MACD, or Bollinger that grabs big moves only, all the while having MACD trade small bonuses along the way. This way you can weight the Risk to Reward of each against eachother.
I will not try to claim this is something you can open and with no work have the best bot on the planet. This scripts intention is to take a lot of relatively common trading strategies and combine them under on roof with some risk management and the ability to weigh each against eachother.
If you are looking for a super advanced singular algorithm that tries to capture every peak and valley exactly on the dot, this is not for you. If you are looking for a tool with a high level of customizability, with a publisher who intends to update it to the best of his ability in accordance to seeking to make the best product that I personally can make for both myself and the community (because I will be using this myself of course!) that was specifically designed with the intention of performing well in spot markets by averaging low entry costs and high exit costs, this is for you! That is the exact intention here.
I do not trade margin currently, I trade spot. I am sure this script can be tuned to work on margin but this is not my intention or area so if this is you and there is something you need for margin specifically implemented, ask, because I likely don't know what you need yet.
The current backtest shown is hand-optimized by myself for BTC/USD 1hr market with NO stop loss enabled and all sales weighed to be around 0% minimum profit from the total average entry cost.
I chose to run it myself with no stop losses because Bitcoin is so bullish to me. The stop losses can still be very profitable, but not 1495% net profit. This style of automation is not for everyone as when running with no stop loss and the requirement every sale is somewhat profitable, or at least no very noticeable loss, you wind up relying on yourself to manually stop out if things crash too much and the bot has to stop trading to wait for market to go back up. The thing to do here if you are playing without a stop loss is to have your own alerts set at your fear level, a % drop in a period of time or something like that, and when you reach that point I would consider resetting the bot so it continues to take trades. I personally will accept a temporary drop in USD as long as I can keep my BTC holdings up overall as the goal should always be to have as many BTC as possible by the start and end of the bull run.

AI ALGO [Ganesh]Core Strategy Components\
1. EMA (Exponential Moving Average) SystemThe strategy uses three EMAs to identify trend direction:
EMA 48 (longer-term trend)
EMA 2 (short-term momentum)
EMA 21 (medium-term trend)
How it works:
Bullish trend: When price is above EMA 21 (green cloud)
Bearish trend: When price is below EMA 21 (red cloud)
EMA Cloud: The area between EMA 2 and EMA 48/21 provides visual trend confirmation
Optional higher timeframe (HTF) analysis for multi-timeframe confirmation
2. DEMA ATR (Double EMA + Average True Range)
This is a dynamic support/resistance indicator that adapts to volatility:Components:
DEMA (Double Exponential Moving Average): Smooths price action with less lag
ATR Bands: Creates upper and lower bands based on volatility (ATR × 1.7 factor)
Signal Generation:
Green line: Uptrend (DEMA ATR rising)
Red line: Downtrend (DEMA ATR falling)
Acts as a trailing stop-loss level that adjusts with market volatility
3. Smart Trail System (Fibonacci-Based)
An advanced trailing stop system using modified true range calculations:Key Features:
Calculates true range using Wilder's smoothing method
Creates Fibonacci retracement levels (61.8%, 78.6%, 88.6%) from the trail line
Adaptive stop-loss: Adjusts based on ATR factor (4.2) and smoothing (4)
Trend Detection:
Bullish: Price > Trailing line (blue zones)
Bearish: Price < Trailing line (red zones)
The Fibonacci zones show potential support/resistance areas
4. ZigZag Indicator Identifies significant swing highs and lows:
Length parameter: 13 (sensitivity control)
Labels: Higher Highs (HH), Lower Lows (LL), etc.
Helps identify trend reversals and key pivot points
5. Support & Resistance Levels
Strength-based S/R: Identifies horizontal support/resistance zones
Zone width: Adjustable percentage-based zones
High/Low zones: Marks significant price levels
Trading LogicEntry Conditions (Implied)The strategy likely enters trades when:Long Entry:
Price crosses above DEMA ATR (green)
Price is above EMA 21 (bullish EMA cloud)
Smart Trail confirms uptrend
Price bounces from Fibonacci support levels
Short Entry:
Price crosses below DEMA ATR (red)
Price is below EMA 21 (bearish EMA cloud)
Smart Trail confirms downtrend
Price rejects from Fibonacci resistance levels
Exit/Stop-Loss Strategy
Trailing stops: Using Smart Trail Fibonacci levels
Dynamic stops: DEMA ATR line acts as a moving stop-loss
Risk management: Position sizing at 50% of equity per trade
Dashboard Features1. Weekly Performance Table
Tracks trades per day of the week
Shows win/loss statistics
Calculates win rate percentage
2. Monthly Performance Table
Monthly P&L breakdown
Yearly performance summary
Color-coded returns (green = profit, red = loss)
Strategy Parameters
Initial Capital: $5,000
Commission: 0.02% per trade
Position Size: 50% of equity
Pyramiding: Disabled (no adding to positions)
Calculation: On bar close (not tick-by-tick)
Visual Elements
EMA clouds: Green (bullish) / Red (bearish)
DEMA ATR line: Dynamic support/resistance
Smart Trail zones: Fibonacci-based colored bands
ZigZag lines: Swing high/low connections
S/R zones: Horizontal support/resistance areas
Strategy Philosophy
This is a trend-following strategy with dynamic risk management that:
Uses multiple timeframes for confirmation
Adapts to volatility through ATR-based indicators
Provides clear visual cues for trend direction
Includes comprehensive performance tracking
Combines momentum (EMAs) with volatility (ATR) for robust signals
The strategy works best in trending markets and uses the Fibonacci trail system to maximize profits while protecting against reversals with adaptive stop-losses.

RSI Risk | AlgoFy TraderRSI Risk | AlgoFy Trader
Overview
The RSI Risk | AlgoFy Trader is a trading system that combines RSI-based entry signals with automated capital management. This strategy identifies potential momentum shifts while controlling risk through calculated position sizing.
Key Features
Dynamic Risk Management:
Fixed Risk Per Trade: Users set maximum risk percentage per trade.
Automatic Position Sizing: Calculates position size based on stop-loss distance.
Capital Protection: Limits each trade's risk to user-defined percentage.
RSI Entry System:
Momentum Detection: Uses RSI crossovers above/below defined thresholds.
Clear Signals: Provides long/short entries on momentum transitions.
Multiple Exit Layers:
Dynamic Stop Loss: Stop based on recent price structure.
Fixed Safety Stop: Optional percentage-based stop loss.
Partial Take Profit: Optional early profit-taking.
Trailing Stop: Optional dynamic profit protection.
Performance Tracking:
Trade Statistics: Tracks win/loss streaks and performance metrics.
Monthly Dashboard: Shows monthly/yearly P&L with equity views.
Trade Details: Displays risk percentage and position size.
How It Works
Signal Detection: Monitors RSI for crossover events.
Risk Calculation: Determines stop-loss based on recent volatility.
Position Sizing: Calculates exact position to match risk percentage.
Example:
Account: $10,000 | Risk: 2% ($200 max)
Stop loss at 4% distance
Position size: $5,000
Result: 4% loss on $5,000 = $200 (2% of account)
Recommended Settings
Risk: 1-2% per trade
Enable fixed stop at 3-4%
Consider trailing stop activation
This script provides disciplined RSI trading with automated risk control, adjusting exposure while maintaining strict risk limits.

KDH v2.0 (English) Trading Strategy Indicator# KDH Diamond Strategy v3.3 - TradingView Description
---
## 🇬🇧 ENGLISH VERSION
### 📊 KDH Diamond Strategy v3.3
**Professional High-Leverage Futures Trading System**
---
#### 🎯 Overview
KDH Diamond is an advanced algorithmic trading strategy specifically optimized for **1-hour timeframe futures trading** with high-leverage environments. Built on proven institutional concepts including Fair Value Gaps (FVG), Volume Profile analysis, and multi-layered confirmation filters, this strategy delivers consistent results without repainting.
---
#### ✨ Key Features
**🔥 Optimized for 1H Timeframe**
- Extensively backtested across multiple markets
- Highest profit rate achieved on 1-hour charts
- Perfect for swing traders and active position management
**🎨 No Repainting - 100% Reliable Signals**
- All signals are confirmed and locked on bar close
- What you see in backtest is what you get in real-time
- Complete transparency with `calc_on_order_fills=true`
**💎 Automated Risk Management**
- Automatic Stop Loss and Take Profit calculation
- Intelligent SL/TP placement based on market structure
- Built-in position sizing controls (adjustable % per trade)
**🚀 High-Leverage Futures Optimized**
- Designed specifically for leveraged futures trading
- Risk-reward ratios calibrated for 10-20x leverage environments
- Precision entry timing to maximize profit potential
**🔄 Advanced Position Management**
- Automatic reversal entries at TP levels
- Multiple re-entry opportunities per signal
- Dynamic trade management based on market conditions
**🎛️ Multi-Layer Confirmation System**
- **SMA50 Filter (1H)**: Trend alignment confirmation
- **Momentum Filter**: KAMA-based directional strength
- **RSI Divergence Filter**: Reversal detection at extremes
- **Volume Profile Filter**: Order flow and liquidity analysis
---
#### 📈 How It Works
**Signal Generation**
The strategy identifies **Inverted Fair Value Gaps (IFVG)** - institutional order blocks that signal high-probability reversal or continuation zones. Each signal is validated through multiple confirmation filters before execution.
**Entry Logic**
- Limit orders placed at optimal price levels within FVG zones
- Price must touch the midline and close in favorable direction
- All filters must align for signal activation
**Exit Strategy**
- Stop Loss: Placed at the next opposing FVG level
- Take Profit: Calculated using nearest FVG in profit direction
- Automatic reversal entry option at TP levels
**Visual System**
- Color-coded boxes show FVG zones (green/red)
- Real-time position tracking with entry, SL, and TP lines
- Comprehensive dashboard displaying filter status and P&L
---
#### 🎯 Who Is This For?
✅ **Perfect For:**
- Futures traders using 10-20x leverage
- Traders seeking systematic, rule-based strategies
- Those who want automated SL/TP management
- 1-hour chart swing traders
- Traders familiar with institutional concepts (FVG, order flow)
❌ **Not Ideal For:**
- Scalpers (designed for 1H timeframe)
- Spot-only traders (optimized for leveraged futures)
- Beginners unfamiliar with leverage risks
- Set-and-forget automated trading (requires monitoring)
---
#### 📊 What You Get
**Strategy Features:**
- Complete FVG detection and inversion system
- 4 professional-grade confirmation filters
- Automated SL/TP calculation and placement
- TP reversal entry system
- Volume Profile sentiment analysis
- Real-time position tracking dashboard
- Webhook alert support for automation
- Clean, organized code with detailed comments
**Visual Components:**
- FVG boxes with inversion coloring
- Volume Profile sentiment boxes (optional)
- Entry, SL, and TP lines for each position
- Position status table with live P&L
- Filter status dashboard
---
#### ⚙️ Customization Options
**Adjustable Filters (User Control):**
- SMA50 Filter (1H) - Trend alignment ON/OFF
- Momentum Filter - Directional strength ON/OFF
- RSI Divergence Filter - Reversal detection ON/OFF
- Volume Profile Filter - Order flow analysis ON/OFF
**Fixed Parameters (Optimized):**
- All core parameters are pre-optimized for 1H timeframe
- Ensures consistent performance without overwhelming options
- Prevents parameter over-fitting by users
---
#### ⚠️ Important Disclaimers
**Risk Warning:**
This strategy is designed for leveraged futures trading, which carries substantial risk. High leverage (10-20x) can result in rapid losses. Only trade with capital you can afford to lose.
**Performance:**
Past performance does not guarantee future results. Always backtest on your specific market and timeframe before live trading.
**Usage:**
This is a trading tool, not financial advice. Users are responsible for their own trading decisions and risk management.
**Requirements:**
- Understanding of futures trading and leverage
- Familiarity with Fair Value Gaps and institutional concepts
- Ability to monitor positions (not fully automated)
- Proper risk management discipline
---
#### 🔧 Technical Specifications
- **Platform:** TradingView Pine Script v5
- **Type:** Strategy (with backtesting capabilities)
- **Timeframe:** Optimized for 1H (works on other timeframes)
- **Markets:** Any futures market (crypto, stocks, indices, forex)
- **Repainting:** NO - All signals are final on bar close
- **Alerts:** Full webhook support for automation
- **Default Settings:** 10% position size, pyramiding enabled (max 10 positions)
---
#### 📞 Support
Questions about setup or usage? Contact the author through TradingView messages.
**Note:** This indicator is for educational and trading tool purposes only. The author is not responsible for trading losses. Trade responsibly and within your risk tolerance.

Strategy with Reference Lines📊 Strategy with Reference Lines
Description:
This strategy uses a contrarian approach based on the analysis of the previous candle to identify entry and exit points. The strategy draws horizontal reference lines at important levels of the previous candle and generates buy/sell signals based on the candle's direction.
Key Features:
🔹 Multi-Timeframe Analysis: Configurable for 1H, 2H, 3H, 4H, 6H, 12H, and 1D
🔹 Reference Lines: High, low, close, and midpoint (50%) of the previous candle
🔹 Visual Signals: Labels with prices and actions (BUY/SELL/TP)
🔹 Optional Trading: Enable/disable automatic order execution
🔹 Complete System: Automatic entry, Take Profit, and Stop Loss
🔹 Alerts: Notifications when a new candle is detected
Strategy Logic:
When the previous candle is POSITIVE:
Signal: 🔴 SELL at the previous candle's close
Take Profit: 🎯 Midpoint (50%) of the previous candle
Stop Loss: 🔴 High of the previous candle
When the previous candle is NEGATIVE:
Signal: 🟢 BUY at the previous candle's close
Take Profit: 🎯 Midpoint (50%) of the previous candle
Stop Loss: 🟢 Low of the previous candle
Visual Elements:
Green Line: High of the previous candle (when positive)
Red Line: Low of the previous candle (when negative)
Yellow Line: Close of the previous candle (always present)
Blue Line: Midpoint (50%) of the previous candle (always present)
Labels: Prices and actions with emojis for easy identification
Settings:
Timeframe: Default 4H (configurable)
Auto Trading: Disabled by default (safety)
Alerts: Include entry prices, TP, and SL
Recommended Usage:
✅ Visual Analysis: Use with trading disabled for analysis
✅ Backtesting: Enable trading to test historically
✅ Swing Trading: Ideal for 4H or higher timeframes
✅ Risk Management: Automatic SL and TP for protection
Risk Disclaimer:
This strategy is for educational and analysis purposes only. Always test in a simulation environment before using with real capital. Trading involves significant risks and may result in losses.

Supertrend pro+ (Adaptive ATR) Supertrend Pro+ (Adaptive ATR) - Param Approach
By SKP
Overview
This advanced Supertrend Pro+ strategy improves on the classic Supertrend indicator by integrating an Adaptive ATR, ensuring dynamic volatility adjustments for more accurate trend detection. This strategy filters out false signals using ADX trend strength validation and volume confirmation, making it a powerful tool for trend-following traders.
Key Features
✔ Adaptive ATR Calculation - Dynamically adjusts to market volatility for more reliable Supertrend signals.
✔ ADX Trend Filter - Ensures trades occur only in strong trending markets, avoiding false breakouts.
✔ Volume Confirmation - Prevents trading in low-liquidity conditions by verifying volume strength.
✔ Multi-Timeframe Analysis - Displays Supertrend trends from different timeframes for enhanced trade confidence.
✔ Trailing Stop & Take Profit Options - Allows flexible risk management with stop-loss and profit-targeting mechanisms.
✔ Custom Alerts for Trade Signals - Alerts trigger on confirmed Supertrend buy/sell signals and potential trend shifts.
✔ Max Drawdown Protection - Automatically closes trades if equity drops beyond a set percentage, preventing excessive losses.
How It Works
Adaptive ATR Calculation
Instead of using a fixed ATR, this strategy calculates an adaptive ATR based on a longer-term ATR baseline.
If volatility increases, the ATR expands dynamically, ensuring stop-losses and Supertrend calculations adjust accordingly.
Supertrend Confirmation
Uses an enhanced Supertrend algorithm with adaptive ATR to determine trend direction.
If price crosses above the trendline, it signals a bullish reversal (Buy Signal).
If price crosses below the trendline, it signals a bearish reversal (Sell Signal).
ADX Trend Strength Filter
Trades are only taken when ADX is above the threshold, ensuring entry in strong trending markets.
Volume Confirmation
Uses a relative volume filter to ensure sufficient liquidity before entering trades.
Helps avoid false breakouts in low-volume conditions.
Risk Management
Trailing Stop Loss - Automatically moves the stop as price moves in favor of the trade.
Manual Stop Loss & Take Profit - Allows precise percentage-based exit points.
Max Drawdown Protection - Closes all trades if equity falls below a set threshold, reducing risk.
Multi-Timeframe Supertrend Table
Displays Supertrend signals across different timeframes (1 min, 5 min, 15 min, 1 hour, Daily)
Helps traders align their entries with higher timeframe trends for better accuracy.
Custom Alerts
Alerts notify when a new buy/sell signal appears.
Extra early warning alerts indicate potential trade setups before confirmation.
How to Use
📌 For trend-following traders:
Focus on entries in the direction of the higher timeframes.
Only enter when ADX is trending and volume confirms liquidity.
📌 For scalpers:
Use shorter timeframes (1m, 5m, 15m) for quick trades.
Adjust the ATR multiplier and Adaptive ATR sensitivity for tighter stops.
📌 For swing traders:
Use longer timeframes (1H, Daily) for more stable trends.
Enable trailing stop loss to lock in profits as the trend progresses.
Inputs & Customization
ATR Period & Adaptive ATR Sensitivity
Supertrend Multiplier
ADX Filter & Threshold
Volume Confirmation Settings
Stop Loss & Take Profit Options
Multi-Timeframe Supertrend Display
Custom Alerts

[3Commas] HA & MAHA & MA
🔷What it does: This tool is designed to test a trend-following strategy using Heikin Ashi candles and moving averages. It enters trades after pullbacks, aiming to let profits run once the risk-to-reward ratio reaches 1:1 while securing the position.
🔷Who is it for: It is ideal for traders looking to compare final results using fixed versus dynamic take profits by adjusting parameters and trade direction—a concept applicable to most trading strategies.
🔷How does it work: We use moving averages to define the market trend, then wait for opposite Heikin Ashi candles to form against it. Once these candles reverse in favor of the trend, we enter the trade, using the last swing created by the pullback as the stop loss. By applying the breakeven ratio, we protect the trade and let it run, using the slower moving average as a trailing stop.
A buy signal is generated when:
The previous candle is bearish (ha_bear ), indicating a pullback.
The fast moving average (ma1) is above the slow moving average (ma2), confirming an uptrend.
The current candle is bullish (ha_bull), showing trend continuation.
The Heikin Ashi close is above the fast moving average (ma1), reinforcing the bullish bias.
The real price close is above the open (close > open), ensuring bullish momentum in actual price data.
The signal is confirmed on the closed candle (barstate.isconfirmed) to avoid premature signals.
dir is undefined (na(dir)), preventing repeated signals in the same direction.
A sell signal is generated when:
The previous candle is bullish (ha_bull ), indicating a temporary upward move before a potential reversal.
The fast moving average (ma1) is below the slow moving average (ma2), confirming a downtrend.
The current candle is bearish (ha_bear), showing trend continuation to the downside.
The Heikin Ashi close is below the fast moving average (ma1), reinforcing bearish pressure.
The real price close is below the open (close < open), confirming bearish momentum in actual price data.
The signal is confirmed after the candle closes (barstate.isconfirmed), avoiding premature entries.
dir is undefined (na(dir)), preventing consecutive signals in the same direction.
In simple terms, this setup looks for trend continuation after a pullback, confirming entries with both Heikin Ashi and real price action, supported by moving average alignment to avoid false signals.
If the price reaches a 1:1 risk-to-reward ratio, the stop will be moved to the entry point. However, if the slow moving average surpasses this level, it will become the new exit point, acting as a trailing stop
🔷Why It’s Unique
Easily visualizes the benefits of using risk-to-reward ratios when trading instead of fixed percentages.
Provides a simple and straightforward approach to trading, embracing the "keep it simple" concept.
Offers clear visualization of DCA Bot entry and exit points based on user preferences.
Includes an option to review the message format before sending signals to bots, with compatibility for multi-pair and futures contract pairs.
🔷 Considerations Before Using the Indicator
⚠️Very important: The indicator must be used on charts with real price data, such as Japanese candlesticks, line charts, etc. Do not use it on Heikin Ashi charts, as this may lead to unrealistic results.
🔸Since this is a trend-following strategy, use it on timeframes above 4 hours, where market noise is reduced and trends are clearer. Also, carefully review the statistics before using it, focusing on pairs that tend to have long periods of well-defined trends.
🔸Disadvantages:
False Signals in Ranges: Consolidating markets can generate unreliable signals.
Lagging Indicator: Being based on moving averages, it may react late to sudden price movements.
🔸Advantages:
Trend Focused: Simplifies the identification of trending markets.
Noise Reduction: Uses Heikin Ashi candles to identify trend continuation after pullbacks.
Broad Applicability: Suitable for forex, crypto, stocks, and commodities.
🔸The strategy provides a systematic way to analyze markets but does not guarantee successful outcomes. Use it as an additional tool rather than relying solely on an automated system.
Trading results depend on various factors, including market conditions, trader discipline, and risk management. Past performance does not ensure future success, so always approach the market cautiously.
🔸Risk Management: Define stop-loss levels, position sizes, and profit targets before entering any trade. Be prepared for potential losses and ensure your approach aligns with your overall trading plan.
🔷 STRATEGY PROPERTIES
Symbol: BINANCE:BTCUSDT (Spot).
Timeframe: 4h.
Test Period: All historical data available.
Initial Capital: 10000 USDT.
Order Size per Trade: 1% of Capital, you can use a higher value e.g. 5%, be cautious that the Max Drawdown does not exceed 10%, as it would indicate a very risky trading approach.
Commission: Binance commission 0.1%, adjust according to the exchange being used, lower numbers will generate unrealistic results. By using low values e.g. 5%, it allows us to adapt over time and check the functioning of the strategy.
Slippage: 5 ticks, for pairs with low liquidity or very large orders, this number should be increased as the order may not be filled at the desired level.
Margin for Long and Short Positions: 100%.
Indicator Settings: Default Configuration.
MA1 Length: 9.
MA2 Length: 18.
MA Calculations: EMA.
Take Profit Ratio: Disable. Ratio 1:4.
Breakeven Ratio: Enable, Ratio 1:1.
Strategy: Long & Short.
🔷 STRATEGY RESULTS
⚠️Remember, past results do not guarantee future performance.
Net Profit: +324.88 USDT (+3.25%).
Max Drawdown: -81.18 USDT (-0.78%).
Total Closed Trades: 672.
Percent Profitable: 35.57%.
Profit Factor: 1.347.
Average Trade: +0.48 USDT (+0.48%).
Average # Bars in Trades: 13.
🔷 HOW TO USE
🔸 Adjust Settings:
The default values—MA1 (9) and MA2 (18) with EMA calculation—generally work well. However, you can increase these values, such as 20 and 40, to better identify stronger trends.
🔸 Choose a Symbol that Typically Trends:
Select an asset that tends to form clear trends. Keep in mind that the Strategy Tester results may show poor performance for certain assets, making them less suitable for sending signals to bots.
🔸 Experiment with Ratios:
Test different take profit and breakeven ratios to compare various scenarios—especially to observe how the strategy performs when only the trade is protected.
🔸This is an example of how protecting the trade works: once the price moves in favor of the position with a 1:1 risk-to-reward ratio, the stop loss is moved to the entry price. If the Slow MA surpasses this level, it will act as a trailing stop, aiming to follow the trend and maximize potential gains.
🔸In contrast, in this example, for the same trade, if we set a take profit at a 1:3 risk-to-reward ratio—which is generally considered a good risk-reward relationship—we can see how a significant portion of the upward move is left on the table.
🔸Results Review:
It is important to check the Max Drawdown. This value should ideally not exceed 10% of your capital. Consider adjusting the trade size to ensure this threshold is not surpassed.
Remember to include the correct values for commission and slippage according to the symbol and exchange where you are conducting the tests. Otherwise, the results will not be realistic.
If you are satisfied with the results, you may consider automating your trades. However, it is strongly recommended to use a small amount of capital or a demo account to test proper execution before committing real funds.
🔸Create alerts to trigger the DCA Bot:
Verify Messages: Ensure the message matches the one specified by the DCA Bot.
Multi-Pair Configuration: For multi-pair setups, enable the option to add the symbol in the correct format.
Signal Settings: Enable whether you want to receive long or short signals (Entry | TP | SL), copy and paste the the messages for the DCA Bots configured.
Alert Setup:
When creating an alert, set the condition to the indicator and choose "alert() function call only.
Enter any desired Alert Name.
Open the Notifications tab, enable Webhook URL, and paste the Webhook URL.
For more details, refer to the section: "How to use TradingView Custom Signals".
Finalize Alerts: Click Create, you're done! Alerts will now be sent automatically in the correct format.
🔷 INDICATOR SETTINGS
MA 1: Fast MA Length
MA 2: Slow MA Length
MA Calc: MA's Calculations (SMA,EMA, RMA,WMA)
TP Ratio: This is the take profit ratio relative to the stop loss, where the trade will be closed in profit.
BE Ratio: This is the breakeven ratio relative to the stop loss, where the stop loss will be updated to breakeven or if the MA2 is greater than this level.
Strategy: Order Type direction in which trades are executed.
Use Custom Test Period: When enabled signals only works in the selected time window. If disabled it will use all historical data available on the chart.
Test Start and End: Once the Custom Test Period is enabled, here you select the start and end date that you want to analyze.
Check Messages: Enable the table to review the messages to be sent to the bot.
Entry | TP | SL: Enable this options to send Buy Entry, Take Profit (TP), and Stop Loss (SL) signals.
Deal Entry and Deal Exit : Copy and paste the message for the deal start signal and close order at Market Price of the DCA Bot. This is the message that will be sent with the alert to the Bot, you must verify that it is the same as the bot so that it can process properly so that it executes and starts the trade.
DCA Bot Multi-Pair: You must activate it if you want to use the signals in a DCA Bot Multi-pair in the text box you must enter (using the correct format) the symbol in which you are creating the alert, you can check the format of each symbol when you create the bot.
👨🏻💻💭 We hope this tool helps enhance your trading. Your feedback is invaluable, so feel free to share any suggestions for improvements or new features you'd like to see implemented.
__
The information and publications within the 3Commas TradingView account are not meant to be and do not constitute financial, investment, trading, or other types of advice or recommendations supplied or endorsed by 3Commas and any of the parties acting on behalf of 3Commas, including its employees, contractors, ambassadors, etc.

Enhanced Bollinger Bands Strategy with SL/TP// Title: Enhanced Bollinger Bands Strategy with SL/TP
// Description:
// This strategy is based on the classic Bollinger Bands indicator and incorporates Stop Loss (SL) and Take Profit (TP) levels for automated trading. It identifies potential long and short entry points based on price crossing the lower and upper Bollinger Bands, respectively. The strategy allows users to customize several parameters to suit different market conditions and risk tolerances.
// Key Features:
// * **Bollinger Bands:** Uses Simple Moving Average (SMA) as the basis and calculates upper and lower bands based on a user-defined standard deviation multiplier.
// * **Customizable Parameters:** Offers extensive customization, including SMA length, standard deviation multiplier, Stop Loss (SL) in pips, and Take Profit (TP) in pips.
// * **Long/Short Position Control:** Allows users to independently enable or disable long and short positions.
// * **Stop Loss and Take Profit:** Implements Stop Loss and Take Profit levels based on pip values to manage risk and secure profits. Entry prices are set to the band levels on signals.
// * **Visualizations:** Provides options to display Bollinger Bands and entry signals on the chart for easy analysis.
// Strategy Logic:
// 1. **Bollinger Bands Calculation:** The strategy calculates the Bollinger Bands using the specified SMA length and standard deviation multiplier.
// 2. **Entry Conditions:**
// * **Long Entry:** Enters a long position when the closing price crosses above the lower Bollinger Band and the `Enable Long Positions` setting is enabled.
// * **Short Entry:** Enters a short position when the closing price crosses below the upper Bollinger Band and the `Enable Short Positions` setting is enabled.
// 3. **Exit Conditions:**
// * **Stop Loss:** Exits the position if the price reaches the Stop Loss level, calculated based on the input `Stop Loss (Pips)`.
// * **Take Profit:** Exits the position if the price reaches the Take Profit level, calculated based on the input `Take Profit (Pips)`.
// Input Parameters:
// * **SMA Length (length):** The length of the Simple Moving Average used to calculate the Bollinger Bands (default: 20).
// * **Standard Deviation Multiplier (mult):** The multiplier applied to the standard deviation to determine the width of the Bollinger Bands (default: 2.0).
// * **Enable Long Positions (enableLong):** A boolean value to enable or disable long positions (default: true).
// * **Enable Short Positions (enableShort):** A boolean value to enable or disable short positions (default: true).
// * **Pip Value (pipValue):** The value of a pip for the traded instrument. This is crucial for accurate Stop Loss and Take Profit calculations (default: 0.0001 for most currency pairs). **Important: Adjust this value to match the specific instrument you are trading.**
// * **Stop Loss (Pips) (slPips):** The Stop Loss level in pips (default: 10).
// * **Take Profit (Pips) (tpPips):** The Take Profit level in pips (default: 20).
// * **Show Bollinger Bands (showBands):** A boolean value to show or hide the Bollinger Bands on the chart (default: true).
// * **Show Entry Signals (showSignals):** A boolean value to show or hide entry signals on the chart (default: true).
// How to Use:
// 1. Add the strategy to your TradingView chart.
// 2. Adjust the input parameters to optimize the strategy for your chosen instrument and timeframe. Pay close attention to the `Pip Value`.
// 3. Backtest the strategy over different periods to evaluate its performance.
// 4. Use the `Enable Long Positions` and `Enable Short Positions` settings to customize the strategy for specific market conditions (e.g., only long positions in an uptrend).
// Important Notes and Disclaimers:
// * **Backtesting Results:** Past performance is not indicative of future results. Backtesting results can be affected by various factors, including market volatility, slippage, and transaction costs.
// * **Risk Management:** This strategy is provided for informational and educational purposes only and should not be considered financial advice. Always use proper risk management techniques when trading. Adjust Stop Loss and Take Profit levels according to your risk tolerance.
// * **Slippage:** The strategy takes into account slippage by specifying a slippage parameter on the `strategy` declaration. However, real-world slippage may vary.
// * **Market Conditions:** The performance of this strategy can vary significantly depending on market conditions. It may perform well in trending markets but poorly in ranging or choppy markets.
// * **Pip Value Accuracy:** **Ensure the `Pip Value` is correctly set for the specific instrument you are trading. Incorrect pip value will result in incorrect stop loss and take profit placement.** This is critical.
// * **Broker Compatibility:** The strategy's performance may vary depending on your broker's execution policies and fees.
// * **Disclaimer:** I am not a financial advisor, and this script is not financial advice. Use this strategy at your own risk. I am not responsible for any losses incurred while using this strategy.

Briss Thorn XtremeStrategy Description: Briss Thorn Xtreme
The Briss Thorn Xtreme is an innovative trading strategy designed to identify and capitalize on opportunities in the forex market through advanced technical analysis and dynamic risk management. This strategy combines calculations based on RSI and ATR with time and day filters, providing customized signals and real-time alerts via Discord. Ideal for traders seeking a structured and highly customizable methodology, Briss Thorn Xtreme integrates enhanced visual tools for efficient trade management.
Key Features:
RSI and ATR-Based Signals: Utilizes smoothed RSI and ATR calculations to identify trends and measure volatility, allowing for more precise detection of buy and sell opportunities.
Dynamic Stop-Loss (SL) and Take-Profit (TP) Levels: Automatically calculates SL and TP levels based on market volatility, dynamically adjusting to optimize risk management.
Advanced Discord Integration: Sends detailed alerts to your Discord channel, including information such as the asset, signal time, entry price, and SL/TP levels, facilitating real-time decision-making.
Complete Customization: Allows users to adjust key parameters such as RSI periods, smoothing factors, liquidity thresholds, trading schedules, and operation days, adapting to different trading styles and market conditions.
Enhanced Chart Visualization: Includes visual elements like candle color changes based on trend, colored boxes for SL and TP, and a summary table of recent trades, enabling quick market interpretation.
Day and Time Operation Filters: Enables selection of specific days of the week and time slots during which signals are generated, optimizing market exposure and avoiding periods of low liquidity or unwanted high volatility.
Trade Summary: Displays a summary of the last three trades directly on the chart, indicating whether TP or SL was reached, aiding in strategy performance evaluation.
Customizable Alert Messages: Allows customization of messages sent to Discord for buy and sell signals, tailoring them to your specific preferences and requirements.
Additional Visual Tools: Highlights the operational range on the chart during permitted trading hours and colors candles based on the current trend (bullish, bearish, or neutral), enhancing visibility and decision-making.
How the Strategy Works:
Technical Indicators Calculation:
- RSI (Relative Strength Index) : Calculates RSI with a defined period and smooths it using an Exponential Moving Average (EMA) to obtain a more stable and reliable signal.
- ATR (Average True Range) : Calculates ATR adjusted by a rapid liquidity factor to measure the current market volatility, thereby determining the strength of the trend.
Generating Buy and Sell Signals:
- Buy Signal: A buy signal is generated when the liquidity index surpasses the short liquidity level, indicating potential accumulation and an upward trend.
- Sell Signal: A sell signal is generated when the liquidity index falls below the long liquidity level, indicating potential distribution and a downward trend.
- Operation Conditions: Signals are only generated on selected days and times, avoiding periods of low liquidity or unwanted high volatility.
Dynamic SL and TP Levels Calculation:
- Stop-Loss (SL) and Take-Profit (TP): SL and TP levels are calculated based on the entry price and a defined number of ticks, automatically adjusting to market volatility to optimize risk management.
- SL and TP Visualization: Colored boxes are drawn on the chart for a clear visual reference of SL and TP levels, facilitating trade management.
Automatic Execution and Alerts:
- Order Execution: Upon signal generation, the strategy automatically executes a market order (buy or sell).
- Discord Alerts: Detailed alerts are sent to the configured Discord channel, providing essential information for swift decision-making, including asset, signal time, entry price, current volatility (ATR), and trend direction.
Trade Management and Monitoring:
- Trade Summary: A table on the chart displays a summary of the last three trades (Today, Yesterday, Day Before Yesterday), indicating whether TP or SL was reached, allowing real-time performance evaluation.
- Automatic Trade Closure: The strategy automatically closes trades upon reaching the established SL or TP levels, ensuring efficient risk management and preventing excessive losses.
Additional Visualization:
- Candle Coloring by Trend: Candles are colored based on the current trend (bullish, bearish, or neutral), facilitating quick identification of market direction.
- Operational Range Highlighting: The chart background is colored during permitted trading hours, highlighting active periods of the strategy and enhancing trade visibility.
---
Strategy Properties (Important)
This backtest is conducted on M17 EURUSD using the following backtesting properties:
Initial Capital: $1000
Order Size: 1% of capital
Commission: $0.20 per order
Slippage: 1 tick
Pyramiding: 1 order
Price Verification for Limit Orders: 0 ticks
Recalculate on Order Execution: Enabled
Recalculate on Every Tick: Enabled
Recalculate After Order Execution: Enabled
Bar Magnifier for Backtesting Precision: Enabled
These properties ensure a realistic preview of the backtesting system. Note that default properties may vary for different reasons:
Order Size: It is essential to calculate the contract size according to the traded asset and desired risk level.
Commission and Slippage: These costs may vary depending on the market and instrument; there is no default value that guarantees realistic results.
All users are strongly recommended to adjust the properties within the script settings to align them with their trading accounts and platforms, ensuring that strategy results are realistic.
---
Backtesting Results:
- Net Profit: $327.90 (32.79%)
- Total Closed Trades: 162
- Profit Percentage: 35.80%
- Profit Factor: 1.298
- Maximum Drawdown: $146.70 (10.27%)
- Average per Trade: $2.02 (0.02%)
- Average Bars per Trade: 22
These results were obtained under the mentioned conditions and properties, providing an overview of the strategy's historical performance.
---
Interpretation of Results:
- The strategy has demonstrated profitability over the analyzed period, albeit with a success rate of 32.79%, indicating that success depends on a favorable risk-reward ratio.
- The profit factor of 1.298 suggests that total gains exceed total losses by this proportion.
- It is crucial to consider the maximum drawdown of 10.27% when evaluating the strategy's suitability to your risk tolerance.
---
Risk Warning:
Trading with leveraged financial instruments involves a high level of risk and may not be suitable for all investors. Before deciding to trade, you should carefully consider your investment objectives, level of experience, and risk tolerance. Past performance does not guarantee future results. It is essential to perform additional testing and adjust the strategy according to your needs.
---
What Makes This Strategy Original?
Unique RSI and Liquidity Focus: Unlike conventional strategies, Briss Thorn Xtreme focuses on combining RSI analysis with liquidity parameters to reflect institutional activity and macroeconomic events that may influence the market.
Advanced Technological Integration: The combination of automatic execution and customized alerts via Discord provides an efficient and modern tool for active traders.
Customization and Adaptability: The wide range of adjustable parameters allows the strategy to adapt to different assets, time zones, and trading styles, offering flexibility and complete user control.
Enhanced Visual Tools: Integrated visual elements, such as candle coloring, SL/TP boxes, and summary tables, facilitate quick market interpretation and informed decision-making.
---
Additional Considerations
Continuous Testing and Optimization: Users are advised to perform additional backtests and optimize parameters based on their own observations and requirements.
Complementary Analysis: Use this strategy in conjunction with other indicators and fundamental analysis tools to reinforce decision-making and confirm generated signals.
Rigorous Risk Management: Ensure that SL and TP levels, as well as position sizes, are aligned with your risk management plan to avoid excessive losses.
Updates and Support: I am committed to providing updates and improvements based on community feedback. For inquiries or suggestions, feel free to contact me.
---
Example Configuration
Assuming you want to use the strategy with the following parameters:
Discord Webhook: Your unique Discord Webhook
RSI Period: 6
RSI Smoothing Factor: 5
Rapid Liquidity Factor: 5
Liquidity Threshold: 5
SL Ticks: 100
TP Ticks: 250
SL/TP Box Width: 25 bars
Trading Days: Monday, Tuesday, Wednesday, Thursday, Friday
Trading Hours: Start at 8:00, End at 11:00
Simulated Initial Capital: $1000
Risk per Trade in Simulation: 1% of capital
Slippage and Commissions in Simulation: 1 tick slippage and $0.20 commission per trade
---
Conclusion
The Briss Thorn Xtreme strategy offers an innovative approach by combining advanced technical analysis with dynamic risk management and modern technological tools. Its original and adaptable design makes it a valuable tool for traders looking to diversify their methods and capitalize on opportunities based on less conventional patterns. Ready for immediate implementation in TradingView, this strategy can enhance your trading arsenal and contribute to a more informed and structured approach in your operations.
---
Final Disclaimer:
Financial markets are volatile and can present significant risks. This strategy should be used as part of a comprehensive trading approach and does not guarantee positive results. It is always advisable to consult with a professional financial advisor before making investment decisions.

FXC NQ Opening Range Breakout Strategy V2.4Mechanical Strategy that trades breakouts on NQ futures on the 15min timeframe during the NYSE session. It's designed to manage Apex and Top Step accounts with the lowest risk possible.
Risk Disclaimer:
Past results as well as strategy tester reports do not indicate future performance. Guarantees do not exist in trading. By using this strategy you risk losing all your money.
Important:
It only trades on Monday, Wednesday and Friday and takes usually only 1 trade per trading day.
It works on the 15min timeframe only.
The settings are optimised already for NQ but feel free to change them.
How it works:
Every selected trading day it measures the range of the first 15min candle after the NYSE open. As soon as price closes above on the 15min timeframe, it will trade the breakout targeting a set risk to reward ratio. SL on the opposite side of the range. It will trail the SL after a set amount of points and uses a buffer of the set amount of points to trail it.
Settings:
Opening Range Time : This is the time of the day in hours and minutes when the strategy starts looking for trades. It's in the EST/ NY Timezone and set to 9:30-09:45 by default
because that's the NYSE open.
Session Time : This is the time of the day in hours and minutes until the strategy trades. It's in the EST/ NY Timezone and set to 09:45-14:45 by default.
because that's what gave the best results in backtesting. Open trades will get closed automatically once the end of the session is reached. No matter if win or loss. This is just to prevent holding positions over night.
Session Border This setting is to select the border color in which the session box will be plotted.
Opening Range Box This setting is to select the fill color of the opening range box.
Opening Range Border This setting is to select the border color of the session box.
Trade Timeframe This setting determines on which timeframe candle has to close outside the opening range box in order to take a trade. It's set to 15min by default because this is what worked by far the best in backtests and live trading.
Stop Loss Buffer in Points: This is simply the buffer in points that is added to the SL for safety reasons. If you have it on 0, the SL will be at the exact price of the opposite side of the range. By default it's set to 0 pips because this is what delivered the best results in backtests.
Profit Target Factor: This is simply the total SL size in points multiplied by x.
Example: If you put 2, you get a 1:2 Risk to Reward Ratio. By Default it's set to 4 because this gave the best results in backtests, because trades always get closed either by trailing SL or because the end of the session is reached.
Use Trailing Stop Loss: This setting is to enable/ disable the trailing stop loss. It's enabled by default because this is a fundamental part of the strategy.
Trailing Stop Buffer: This setting determines after how many points in profit the trailing SL will be activated.
Risk Type: You can chose either between Fixed USD Amount, Risk per Trade in % or Fixed Contract Size. By default it's set to fixed contract size.
Risk Amount (USD or Contracts): This setting is to set how many USD or how many contracts you want to risk per trade. Make sure to check which risk type you have selected before you chose the risk amount.
Use Limit Orders If enabled, the strategy will place a pending order x points from the current price, instead of a market order. Limit orders are enabled by default for a better performance. Important: It doesn't actually place a limit order. The strategy will just wait for a pullback and then enter with a market order. It's more like a hidden limit order.
Limit Order Distance (points): If you have limit orders enabled, this setting determines how many points from the current price the limit order will be placed.
Trading Days: These checkboxes are to select on which week days the strategy has to trade. Thursday is disabled by default because backtests have shown that Thursday is the least profitable day
Backtest Settings:
For the backtest the commissions ere set to 0.35 USD per mini contract which is the highest amount Tradeovate charges. Margin was not accounted for because typically on Apex accounts you can use way more contracts than you need for the extremely low max drawdown. Margin would be important on personal accounts but even there typically it's not an issue at all especially because this strategy runs on the 15min timeframe so it won't use a lot of contracts anyways.
What makes it unique:
This script is unique because it's designed to be used on Apex and Top Step accounts with extremely strict drawdown rules.
The strategy is optimised to be traded with a fixed contract size instead of using % risk. The reason for that is that the drawdown rules of these Futures Prop Accounts are very strict and the fact that the smallest trade-able contract size is 1.
Why the source code is hidden:
The source code is hidden because I invested a lot of time and money into developing this strategy and optimising it with paid 3rd party software. Also since I use it myself on my Apex accounts and prop firms don't allow copy trading I don't want it to be used by too many traders.
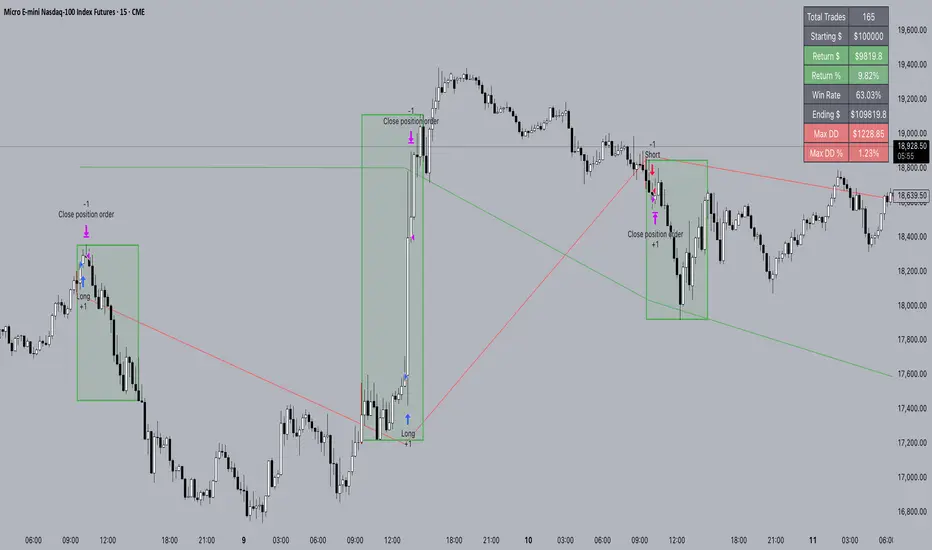
Skeleton Key LiteSkeleton Key Lite Strategy
Note : Every input, except for the API Alerts, depends on an external indicator to provide the necessary values for the strategy to function.
Definitions
Strategy Direction: The trading direction (long or short) as determined by an external source, such as an indicator.
Threshold Conditions:
- Enter Condition: Defines the condition for entering a trade.
- Exit Condition: Defines the condition for exiting a trade.
Stop Loss (SL):
- Trail SL: A trailing stop loss, dynamically updated during the trade.
- Basic SL: A static stop loss level.
- Emergency SL (ER SL): A fallback stop loss for extreme conditions.
- Max SL: The maximum risk tolerance in stop loss.
- Limit SL: A predefined stop loss that is executed as a limit order.
Take Profit (TP):
- Max TP: The maximum profit target for a trade.
- Limit TP: A predefined take profit level executed as a limit order.
API Alerts:
- API Entry: JSON-based configuration for sending entry signals.
- API Exit: JSON-based configuration for sending exit signals.
Broad Concept
The Skeleton Key Lite strategy script is designed to provide a generalized framework for orchestrating trade execution based on external indicators. It allows QuantAlchemy and others to encapsulate strategies into indicators, which can then be backtested and automated using this strategy script.
Inputs
Note : All inputs are dependent on external indicators for values except for the API Alerts.
Strategy Direction:
- Source: Direction signal from an external indicator.
- Options: `LONG` (`1`), `SHORT` (`-1`).
Trade Conditions:
- Enter: Source input, trigger for entry condition.
- Exit: Source input, trigger for exit condition.
Stops and Take Profits:
- Trail SL: Enable/disable dynamic trailing stop loss.
- Basic SL: Enable/disable static stop loss.
- Emergency SL: Enable/disable emergency stop loss.
- Max SL: Enable/disable maximum risk stop loss.
- Max TP: Enable/disable maximum take profit.
- Limit SL: Enable/disable predefined stop loss executed as a limit order.
- Limit TP: Enable/disable predefined take profit executed as a limit order.
Alerts:
- API Entry: Configurable JSON message for entry signals.
- API Exit: Configurable JSON message for exit signals.
How It Works
Trade Logic:
- Conditions for entering and exiting trades are evaluated based on the selected input sources.
Stop Loss and Take Profit Management:
- Multiple stop loss types (trailing, basic, emergency, etc.) and take profit levels are calculated dynamically during the trade entry. Trailing stop loss is updated during the trade based on the selected input.
API Alerts:
- Alerts are triggered using customizable JSON messages, which can be integrated with external trading systems or APIs.
Trade Execution:
- Enter: Initiates a new trade if entry conditions are met and there is no open position.
- Exit: Closes all trades if exit conditions are met or stop loss/take profit thresholds are hit.
Key Features
Customizable: Fully configurable entry and exit conditions based on external indicators.
Encapsulation: Integrates seamlessly with indicators, allowing strategies to be developed as indicator-based signals.
Comprehensive Risk Management:
- Multiple stop loss and take profit options.
- Emergency stop loss for unexpected conditions.
API Integration: Alerts are designed to interface with external systems for automation and monitoring.
Plots
The script plots key variables on the chart for better visualization:
Enter and Exit Signals:
- `enter`: Displays when the entry condition is triggered.
- `exit`: Displays when the exit condition is triggered.
Risk Management Levels:
- `trailSL`: Current trailing stop loss level.
- `basicSL`: Static stop loss level.
- `erSL`: Emergency stop loss level.
- `maxSL`: Maximum risk stop loss level.
Profit Management Levels:
- `maxTP`: Maximum take profit level.
- `limitTP`: Limit-based take profit level.
Limit Orders:
- `limitSL`: Limit-based stop loss level.
- `limitTP`: Limit-based take profit level.
Proposed Interpretations
Entry and Exit Points:
- Use the plotted signals (`enter`, `exit`) to analyze the trade entry and exit points visually.
Risk and Profit Levels:
- Monitor the stop loss (`SL`) and take profit (`TP`) levels to assess trade performance.
Dynamic Trail SL:
- Observe the `trailSL` to evaluate how the trailing stop adapts during the trade.
Limitations
Dependence on Indicators:
- This script relies on external indicators to provide signals for strategy execution.
No Indicator Included:
- Users must integrate an appropriate indicator for source inputs.
Back-Test Constraints:
- Back-testing results depend on the accuracy and design of the integrated indicators.
Final Thoughts
The Skeleton Key Lite strategy by QuantAlchemy provides a robust framework for automated trading by leveraging indicator-based signals. Its flexibility and comprehensive risk management make it a valuable tool for traders seeking to implement and backtest custom strategies.
Disclaimer
This script is for educational purposes only. Trading involves risk, and past performance does not guarantee future results. Use at your own discretion and risk.
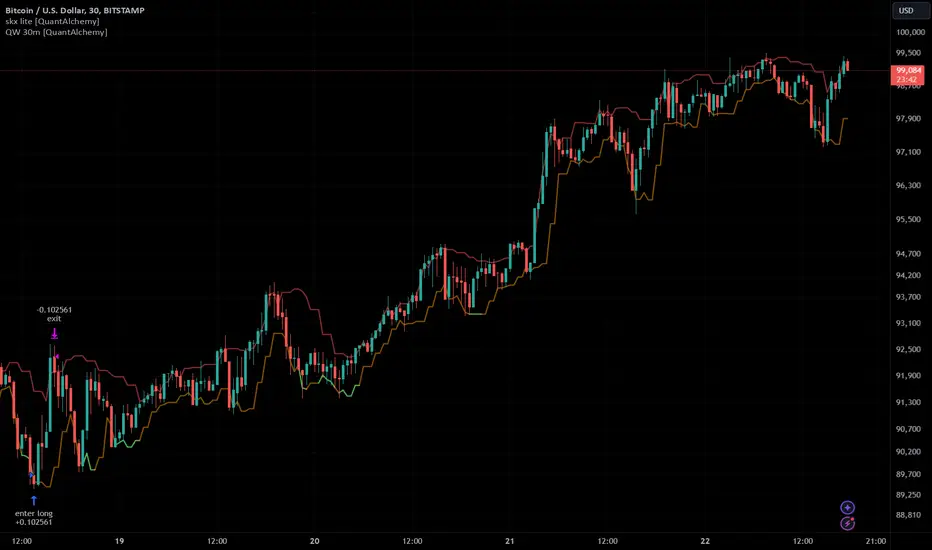
Liquidity strategy tester [Influxum]This tool is based on the concept of liquidity. It includes 10 methods for identifying liquidity in the market. Although this tool is presented as a strategy, we see it more as a data-gathering instrument.
Warning: This indicator/strategy is not intended to generate profitable strategies. It is designed to identify potential market advantages and help with identifying effective entry points to capitalize on those advantages.
Once again, we have advanced the methods of effectively searching for liquidity in the market. With strategies, defined by various entry methods and risk management, you can find your edge in the market. This tool is backed by thorough testing and development, and we plan to continue improving it.
In its current form, it can also be used to test well-known ICT or Smart Money concepts. Using various methods, you can define market structure and identify areas where liquidity is located.
Fair Value Gaps - one of the entry signal options is fair value gaps, where an imbalance between buyers and sellers in the market can be expected.
Time and Price Theory - you can test this by setting liquidity from a specific session and testing entries as that liquidity is grabbed
Judas Swing - can be tested as a market reversal after a breakout during the first hours of trading.
Power of Three - accumulation can be observed as the market moving within a certain range, identified as cluster liquidity in our tool, manipulation occurs with the break of liquidity, and distribution is the direction of the entry.
🟪 Methods of Identifying Liquidity
Pivot Liquidity
This refers to liquidity formed by local extremes – the highest or lowest prices reached in the market over a certain period. The period is defined by a pivot number and determines how many candles before and after the high/low were higher/lower. Simply put, the pivot number represents the number of adjacent candles to the left and right, with a lower high for a pivot high and a higher low for a pivot low. The higher the number, the more significant the high/low is. Behind these local market extremes, we expect to find orders waiting for breakout as well as stop-losses.
Gann Swing
Similar to pivot liquidity, Gann swing identifies significant market points. However, instead of candle highs and lows, it focuses on the closing prices. A Gann swing is formed when a candle closes above (or below) several previous closes (the number is again defined by a strength parameter).
Percentage Change
Apart from ticks, percentages are also a key unit of market movement. In the search for liquidity, we monitor when a local high or low is formed. For liquidity defined by percentage change, a high must be a certain percentage higher than the last low to confirm a significant high. Similarly, a low must be a defined percentage away from the last significant high to confirm a new low. With the right percentage settings, you can eliminate market noise.
Session Range (3x)
Session range is a popular concept for finding liquidity, especially in smart money concepts (SMC). You can set up liquidity visualization for the Asian, London, or New York sessions – or even all three at once. This tool allows you to work with up to three sessions, so you can easily track how and if the market reacts to liquidity grabs during these sessions.
Tip for traders: If you want to see the reaction to liquidity grab during a specific session at a certain time (e.g., the well-known killzone), you can set the Trading session in this tool to the exact time where you want to look for potential entries.
Unfinished Auction
Based on order flow theory, an unfinished auction occurs when the market reverses sharply without filling all pending orders. In price action terms, this can be seen as two candles at a local high or low with very similar or identical highs/lows. The maximum difference between these values is defined as Tolerance, with the default setting being 3 ticks. This setting is particularly useful for filtering out noise during slower market periods, like the Asian session.
Double Tops and Bottoms
A very popular concept not only from smart money concepts but also among price pattern traders is the double bottom and double top. This occurs when the market stops and reverses at a certain price twice in a row. In the tool, you can set how many candles apart these bottoms/tops can be by adjusting the Length parameter. According to some theories, double bottoms are more effective when there is a significant peak between the two bottoms. You can set this in the tool as the Swing value, which defines how large the movement (expressed in ticks) must be between the two peaks/bottoms. The final parameter you can adjust is Tolerance, which defines the possible price difference between the two peaks/bottoms, also expressed in ticks.
Range or Cluster Liquidity
When the market stays within a certain price range, there’s a chance that breakout orders and stop-losses are accumulating outside of this range. Our tool defines ranges in two ways:
Candle balance calculates the average price within a candle (open, high, low, and close), and it defines consolidation when the centers of candles are within a certain distance from each other.
Overlap confirms consolidation when a candle overlaps with the previous one by a set percentage.
Daily, Weekly, and Monthly Highs or Lows
These options simply define liquidity as the previous day’s, week’s, or month’s highs or lows.
Visual Settings
You can easily adjust how liquidity is displayed on the chart, choosing line style, color, and thickness. To display only uncollected liquidity, select "Delete grabbed liquidity."
Liquidity Duration
This setting allows you to control how long liquidity areas remain valid. You can cancel liquidity at the end of the day, the second day, or after a specific number of candles.
🟪 Strategy
Now we come to the part of working with strategies.
Max # of bars after liquidity grab – This parameter allows you to define how many candles you can search for entry signals from the moment liquidity is grabbed. If you are using engulfing as an entry signal, which consists of 2 candles, keep in mind that this number must be at least 2. In general, if you want to test a quick and sharp reaction, set this number as low as possible. If you want to wait for a structural change after the liquidity grab, which may require more candles, set the number a bit higher.
🟪 Strategy - entries
In this section, we define the signals or situations where we can enter the market after liquidity has been taken out.
Liquidity grab - This setup triggers a trade immediately after liquidity is grabbed, meaning the trade opens as the next candle forms.
Close below, close above - This refers to situations where the price closes below liquidity, but then reverses and closes above liquidity again, suggesting the liquidity grab was a false breakout.
Over bar - This occurs when the entire candle (high and low) passes beyond the liquidity level but then experiences a pullback.
Engulfing - A popular price action pattern that is included in this tool.
2HL - weak, medium, strong - A variation of a popular candlestick pattern.
Strong bar - A strong reactionary candle that forms after a liquidity grab. If liquidity is grabbed at a low, this would be a strong long candle that closes near its high and is significantly larger compared to typical volatility.
Naked bar - A candlestick pattern we’ve tested that serves as a good confirmation of market movement.
FVG (Fair Value Gap) - A currently popular concept. This is the only signal with additional settings. “Pending FVG order valid” means if a fair value gap forms after a liquidity grab, a limit order is placed, which remains valid for a set number of candles. “FVG minimal tick size” allows you to filter based on the gap size, measured in ticks. “GAP entry model” lets you decide whether to place the limit order at the gap close or its edge.
🟪 Strategy - General
Long, short - You can choose whether to focus on long or short trades. It’s interesting to see how long and short trades yield different results across various markets.
Pyramiding - By default, the tool opens only one trade at a time. If a new signal arises while a trade is open, it won’t enter another position unless the pyramiding box is checked. You also need to set the maximum number of open trades in the Properties.
Position size - Simply set the size of the traded position.
🟪 Strategy - Time
In this section, you can set time parameters for the strategy being tested.
Test since year - As the name implies, you can limit the testing to start from a specific year.
Trading session - Define the trading session during which you want to test entries. You can also visualize the background (BG) for confirmation.
Exclude session - You can set a session period during which you prefer not to search for trades. For example, when the New York session opens, volatility can sharply increase, potentially reducing the long-term success rate of the tested setup.
🟪 Strategy - Exits
This section lets you define risk management rules.
PT & SL - Set the profit target (PT) and stop loss (SL) here.
Lowest/highest since grab - This option sets the stop loss at the lowest point after a liquidity grab at a low or at the highest point after a liquidity grab at a high. Since markets usually overshoot during liquidity grabs, it’s good practice to place the stop loss at the furthest point after the grab. You can also set your risk-reward ratio (RRR) here. A value of 1 sets an RRR of 1:1, 2 means 2:1, and so on.
Lowest/highest last # bars - Similar to the previous option, but instead of finding the extreme after a liquidity grab, it identifies the furthest point within the last number of candles. You can set how far back to look using the # bars field (for an engulfing pattern, 2 is optimal since it’s made of two candles, and the stop loss can be placed at the edge of the engulfing pattern). The RRR setting works the same way as in the previous option.
Other side liquidity grab - If this option is checked, the trade will exit when liquidity is grabbed on the opposite side (i.e., if you entered on a liquidity grab at a low, the trade will exit when liquidity is grabbed at a high).
Exit after # bars - A popular exit strategy where you close the position after a set number of candles.
Exit after # bars in profit - This option exits the trade once the position is profitable for a certain number of consecutive candles. For example, if set to 5, the position will close when 5 consecutive candles are profitable. You can also set a maximum number of candles (in the max field), ensuring the trade is closed after a certain time even if the profit condition hasn’t been met.
🟪 Alerts
Alerts are a key tool for traders to ensure they don’t miss trading opportunities. They also allow traders to manage their time effectively. Who would want to sit in front of the computer all day waiting for a trading opportunity when they could be attending to other matters? In our tool, you currently have two options for receiving alerts:
Liquidity grabs alert – if you enable this feature and set an alert, the alert will be triggered every time a candle on the current timeframe closes and intersects with the displayed liquidity line.
Entry signals alert – this feature triggers an alert when a signal for entry is generated based on the option you’ve selected in the Entry type. It’s an ideal way to be notified only when a trading opportunity appears according to your predefined rules.

Nifty scalping 3 minutesOverview:
The "Nifty Scalping 3 Minutes" strategy is a uniquely tailored trading system for Nifty Futures traders, with a clear focus on capital preservation, dynamic risk management, and high-probability trade entries. This strategy uses unique combination of standard technical indicators like Jurik Moving Average (JMA), Exponential Moving Average (EMA), and Bollinger Bands, but it truly stands out through its Price-Volume Spike Detection system—a unique mechanism designed to trigger trades only during periods of high momentum and market participation. The strategy also incorporates robust risk management, ensuring that traders minimize losses while maximizing profits. in complete back test range max drawdown is less than 1%
Scalping Approach and Requirements:
The strategy focuses on quick in and out trades, aiming to capture small, quick profits during periods of heightened market activity. For optimal performance, traders should have ₹2,00,000 or more in capital available per trade. The dynamic lot calculation and risk controls require this level of capital to function effectively.
Small, frequent trades are the focus, and the strategy is ideal for traders comfortable with high-frequency executions. Traders with insufficient capital or those not comfortable with frequent trades may find this strategy unsuitable.
Default Properties for Publication:
Initial Capital: ₹2,000,000
Lot Size: 25 contracts (adjusted dynamically based on available margin)
Stop-Loss: Risk per trade capped at 1% of equity.
Slippage and Commission: Realistic values are factored into the backtesting.
Key Feature: Price-Volume Spike Detection
1. Condition: Trades are executed only when there is a significant price spike confirmed by a volume spike. The candle width is calculated by multiplying the price change (difference between the candle's open and close) by the volume, and this result is compared to a 126-period average of both price and volume.
A trade is triggered when the current price-volume spike exceeds this average by a preset volume multiplier (default set at 3). This ensures that both the price change and volume are unusually strong compared to normal market behavior.
2. Reasoning: Many traders fail to incorporate the relationship between price movement and volume effectively. By using this Price-Volume Spike Detection mechanism, the strategy ensures that it only enters trades during periods of strong market momentum when both price and volume confirm a real market move, not just noise or small fluctuations.
The 126-period moving average of volume is chosen specifically because it represents a complete trading session on the 3-minute chart. This ensures that the volume spike is compared against a realistic baseline of daily activity, making the detection more robust and reliable.
The volume multiplier allows flexibility in determining the threshold for a significant spike, enabling users to fine-tune the strategy according to their risk tolerance and market conditions.
Trade Placement Logic:
1. Trend Confirmation with JMA and EMA:
Condition: The strategy will only consider entering a trade when JMA crosses above EMA for a long trade or JMA crosses below EMA for a short trade.
Reasoning: The JMA is used for its low lag and responsiveness, allowing it to capture early trends, while the EMA adds a level of confirmation by weighing recent price action more heavily. This dual confirmation ensures that trades are entered only when a solid trend is in place.
2. Bollinger Bands for Volatility Breakouts:
Condition: In addition to the JMA-EMA crossover, the price must break outside the Bollinger Bands—above the upper band for long trades, or below the lower band for short trades.
Reasoning: Bollinger Bands are a volatility indicator. By requiring a price breakout beyond the bands, the strategy ensures that trades are placed during periods of high volatility, avoiding low-momentum, sideways markets.
3. Volume and Price Confirmation (Price-Volume Spike Detection):
Condition: A trade is only triggered if the price-volume spike condition is met. This ensures that the market move is backed by strong volume and that the price change is significant relative to the recent average activity.
Reasoning: This condition filters out low-volume environments where price movements are more likely to reverse or stall. By waiting for a spike in both price and volume, the strategy ensures that it enters trades during high-momentum periods, where follow-through is more likely.
Exit Logic and Risk Management:
1. Stop-Loss (SL) Placement:
Condition: Upon entering a trade, an initial stop-loss is placed below the candle low for long trades or above the candle high for short trades. This is adjusted if the risk exceeds 1% of total capital.
Reasoning: The stop-loss is placed at a logical level that accounts for recent price action, ensuring that the trade is given room to develop while protecting capital from unexpected market reversals.
2. Profit Target and Partial Profit Booking:
Condition: The first profit target is set at 2.1x the initial risk for long trades, and 2.5x the initial risk for short trades.
Reasoning: The 2.1x risk-reward ratio for long trades provides a solid return while maintaining a conservative risk profile. For short trades, the strategy uses a higher 2.5x risk-reward ratio because market falls tend to be sharper and quicker than rises, allowing for larger profit targets to be reached more reliably.
Partial Profit Booking: Once the first target is hit, 60% of the position is closed to lock in profits. The remaining 40% is left to run with a trailing stop.
3. ATR-Based Trailing Stop:
Condition: Once the first target is hit, the ATR (Average True Range) trailing stop is applied to the remaining position. This dynamically adjusts the stop-loss as the trade moves in a favorable direction.
Reasoning: The trailing stop allows the trade to capture further gains if the trend continues, while protecting profits if the momentum weakens. The ATR ensures that the stop adjusts according to the market's current volatility, providing flexibility and protection.
4. Time-Based Exit:
Condition: If a trade is still open by 3:20 PM, it is automatically closed to avoid end-of-day volatility.
Reasoning: The time-based exit ensures that trades are not held into the often-volatile closing minutes of the market, reducing the risk of unexpected price swings.
Capital and Risk Management:
1. Lot Size Calculation:
Condition: The strategy calculates the number of lots dynamically based on the available margin. It uses only 10% of total equity for each trade, and ensures that the maximum risk per trade does not exceed 1% of total capital.
Reasoning: This ensures that traders are not over-leveraged and that the risk is controlled for each trade. Capital protection is at the core of the strategy, ensuring that even during adverse market conditions, the trader’s capital is preserved.
2. Stop-Loss Protection:
Condition: The stop-loss is designed to ensure that no more than 1% of capital is at risk in any trade.
Reasoning: By limiting risk exposure, the strategy focuses on long-term capital preservation while still allowing for profitable trades in favorable market conditions.
STBT/BTST Facilitation:
1. Feature: The strategy allows traders the option to hold positions overnight, facilitating STBT (Sell Today Buy Tomorrow) and BTST (Buy Today Sell Tomorrow) trades.
Reasoning: Backtests show that holding positions overnight when all trade conditions are still valid can lead to beneficial outcomes. This feature allows traders to take advantage of overnight market movements, providing flexibility beyond intraday trades.
Why This Strategy Stands Out:
Price-Volume Spike Detection: Unlike traditional strategies, this one uniquely focuses on Price-Volume Spike Detection to filter out low-probability trades. By ensuring that both price and volume spikes are present, the strategy guarantees that trades are placed only when there is significant market momentum.
Risk Management with Capital Protection: The strategy strictly limits the risk per trade to 1% of capital, ensuring long-term capital preservation. This is especially important for traders who wish to avoid large drawdowns and prefer a sustainable approach to trading.
2.5x Risk-Reward for Short Trades: Recognizing the sharpness of market declines, the strategy employs a 2.5x risk-reward ratio for short trades, maximizing profits during bearish trends.
Dynamic Exit Strategy: With partial profit booking and ATR-based trailing stops, the strategy is designed to capture gains efficiently while protecting capital through dynamic exit conditions.
Summary of Execution:
Entry: Triggered when JMA crosses EMA, combined with Bollinger Band breakouts and Price-Volume Spike Detection.
Capital Management: Trades are executed with 10% of available capital, and the risk per trade is capped at 1%.
Exit: Trades exit when stop-loss, ATR trailing stop, or time-based exit conditions are met.
Profit Booking: 60% of the position is closed at the first target, with the remainder trailed using an ATR-based stop.

BTC 5 min SHBHilalimSB A Wedding Gift 🌙
What is HilalimSB🌙?
First of all, as mentioned in the title, HilalimSB is a wedding gift.
HilalimSB - Revealing the Secrets of the Trend
HilalimSB is a powerful indicator designed to help investors analyze market trends and optimize trading strategies. Designed to uncover the secrets at the heart of the trend, HilalimSB stands out with its unique features and impressive algorithm.
Hilalim Algorithm and Fixed ATR Value:
HilalimSB is equipped with a special algorithm called "Hilalim" to detect market trends. This algorithm can delve into the depths of price movements to determine the direction of the trend and provide users with the ability to predict future price movements. Additionally, HilalimSB uses its own fixed Average True Range (ATR) value. ATR is an indicator that measures price movement volatility and is often used to determine the strength of a trend. The fixed ATR value of HilalimSB has been tested over long periods and its reliability has been proven. This allows users to interpret the signals provided by the indicator more reliably.
ATR Calculation Steps
1.True Range Calculation:
+ The True Range (TR) is the greatest of the following three values:
1. Current high minus current low
2. Current high minus previous close (absolute value)
3. Current low minus previous close (absolute value)
2.Average True Range (ATR) Calculation:
-The initial ATR value is calculated as the average of the TR values over a specified period
(typically 14 periods).
-For subsequent periods, the ATR is calculated using the following formula:
ATRt=(ATRt−1×(n−1)+TRt)/n
Where:
+ ATRt is the ATR for the current period,
+ ATRt−1 is the ATR for the previous period,
+ TRt is the True Range for the current period,
+ n is the number of periods.
Pine Script to Calculate ATR with User-Defined Length and Multiplier
Here is the Pine Script code for calculating the ATR with user-defined X length and Y multiplier:
//@version=5
indicator("Custom ATR", overlay=false)
// User-defined inputs
X = input.int(14, minval=1, title="ATR Period (X)")
Y = input.float(1.0, title="ATR Multiplier (Y)")
// True Range calculation
TR1 = high - low
TR2 = math.abs(high - close )
TR3 = math.abs(low - close )
TR = math.max(TR1, math.max(TR2, TR3))
// ATR calculation
ATR = ta.rma(TR, X)
// Apply multiplier
customATR = ATR * Y
// Plot the ATR value
plot(customATR, title="Custom ATR", color=color.blue, linewidth=2)
This code can be added as a new Pine Script indicator in TradingView, allowing users to calculate and display the ATR on the chart according to their specified parameters.
HilalimSB's Distinction from Other ATR Indicators
HilalimSB emerges with its unique Average True Range (ATR) value, presenting itself to users. Equipped with a proprietary ATR algorithm, this indicator is released in a non-editable form for users. After meticulous testing across various instruments with predetermined period and multiplier values, it is made available for use.
ATR is acknowledged as a critical calculation tool in the financial sector. The ATR calculation process of HilalimSB is conducted as a result of various research efforts and concrete data-based computations. Therefore, the HilalimSB indicator is published with its proprietary ATR values, unavailable for modification.
The ATR period and multiplier values provided by HilalimSB constitute the fundamental logic of a trading strategy. This unique feature aids investors in making informed decisions.
Visual Aesthetics and Clear Charts:
HilalimSB provides a user-friendly interface with clear and impressive graphics. Trend changes are highlighted with vibrant colors and are visually easy to understand. You can choose colors based on eye comfort, allowing you to personalize your trading screen for a more enjoyable experience. While offering a flexible approach tailored to users' needs, HilalimSB also promises an aesthetic and professional experience.
Strong Signals and Buy/Sell Indicators:
After completing test operations, HilalimSB produces data at various time intervals. However, we would like to emphasize to users that based on our studies, it provides the best signals in 1-hour chart data. HilalimSB produces strong signals to identify trend reversals. Buy or sell points are clearly indicated, allowing users to develop and implement trading strategies based on these signals.
For example, let's imagine you wanted to open a position on BTC on 2023.11.02. You are aware that you need to calculate which of the buying or selling transactions would be more profitable. You need support from various indicators to open a position. Based on the analysis and calculations it has made from the data it contains, HilalimSB would have detected that the graph is more suitable for a selling position, and by producing a sell signal at the most ideal selling point at 08:00 on 2023.11.02 (UTC+3 Istanbul), it would have informed you of the direction the graph would follow, allowing you to benefit positively from a 2.56% decline.
Technology and Innovation:
HilalimSB aims to enhance the trading experience using the latest technology. With its innovative approach, it enables users to discover market opportunities and support their decisions. Thus, investors can make more informed and successful trades. Real-Time Data Analysis: HilalimSB analyzes market data in real-time and identifies updated trends instantly. This allows users to make more informed trading decisions by staying informed of the latest market developments. Continuous Update and Improvement: HilalimSB is constantly updated and improved. New features are added and existing ones are enhanced based on user feedback and market changes. Thus, HilalimSB always aims to provide the latest technology and the best user experience.
Social Order and Intrinsic Motivation:
Negative trends such as widespread illegal gambling and uncontrolled risk-taking can have adverse financial effects on society. The primary goal of HilalimSB is to counteract these negative trends by guiding and encouraging users with data-driven analysis and calculable investment systems. This allows investors to trade more consciously and safely.
What is BTC 5 min ☆SHB Strategy🌙?
BTC 5 min ☆SHB Strategy is a strategy supported by the HilalimSB algorithm created by the creator of HilalimSB. It automatically opens trades based on the data it receives, maintaining trades with its uniquely defined take profit and stop loss levels, and automatically closes trades when necessary. It stands out in the TradingView world with its unique take profit and stop loss markings. BTC 5 min ☆SHB Strategy is close to users' initiatives and is a strategy suitable for 5-minute trades and scalp operations developed on BTC.
What does the BTC 5 min ☆SHB Strategy target?
The primary goal of BTC 5 min ☆SHB Strategy is to close trades made by traders in short timeframes as profitably as possible and to determine the most effective trading points in low time periods, considering the commission rates of various brokerage firms. BTC 5 min ☆SHB Strategy is one of the rare profitable strategies released in short timeframes, with its useful interface, in addition to existing strategies in the markets. After extensive backtesting over a long period and achieving above-average success, BTC 5 min ☆SHB Strategy was decided to be released. Following the completion of test procedures under market conditions, it was presented to users with the unique visual effects of ☆SB.
BTC 5 min ☆SHB Strategy and Heikin Ashi
BTC 5 min ☆SHB Strategy produces data in Heikin-Ashi chart types, but since Heikin-Ashi chart types have their own calculation method, BTC 5 min ☆SHB Strategy has been published in a way that cannot produce data in this chart type due to BTC 5 min ☆SHB Strategy's ideology of appealing to all types of users, and any confusion that may arise is prevented in this way. Heikin-Ashi chart types, especially in short time intervals, carry significant risks considering the unique calculation methods involved. Thus, the possibility of being misled by the coder and causing financial losses has been completely eliminated. After the necessary conditions determined by the creator of BTC 5 min ☆SHB are met, BTC 5 min ☆SHB Heikin-Ashi will be shared exclusively with invited users only, upon request, to users who request an invitation.
Key Features:
+HilalimSHB Algorithm: This algorithm uses a dynamic ATR-based trend-following mechanism to identify the current market trend. The strategy detects trend reversals and takes positions accordingly.
+Heikin Ashi Compatibility: The strategy is optimized to work only with standard candlestick charts and automatically deactivates when Heikin Ashi charts are in use, preventing false signals.
+Advanced Chart Enhancements: The strategy offers clear graphical markers for buy/sell signals. Candlesticks are automatically colored based on trend direction, making market trends easier to follow.
Strategy Parameters:
+Take Profit (%): Defines the target price level for closing a position and automates profit-taking. The fixed value is set at 2%.
+Stop Loss (%): Specifies the stop-loss level to limit losses. The fixed value is set at 3%.
The shared image is a 5-minute chart of BTCUSDC.P with a fixed take profit value of 2% and a fixed stop loss value of 3%. The trades are opened with a commission rate of 0.063% set for the USDT trading pair on Binance.🌙
